
Trailer Demand & Economic Activity
How freight demand, economic activity, trailer type, fleet age, and replacement cycles shape U.S. trailer market demand.
Trailer demand is closely connected to freight demand, economic activity, fleet investment, equipment utilization, and replacement cycles. When freight-generating sectors grow, the market needs enough trailers to move, stage, store, and deliver goods. When freight softens or capacity is oversupplied, trailer orders and production can slow. ACT Research tracks these relationships to help customers understand how trailer demand changes across the freight and equipment cycle.
Common trailer types and what they carry
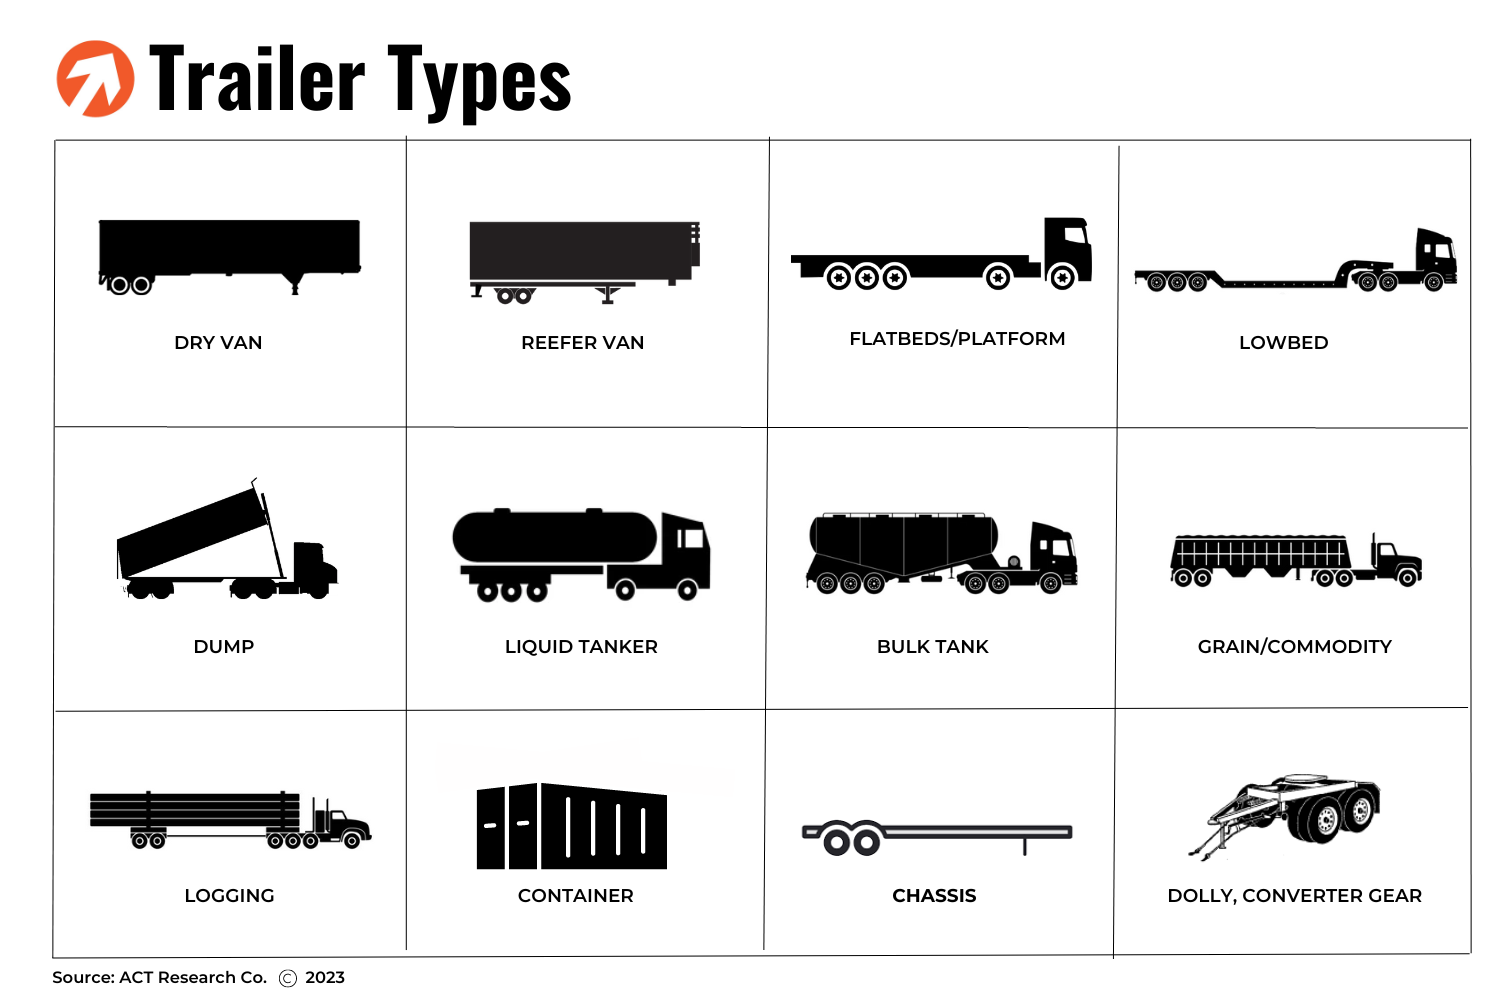
Different trailer types serve different freight markets. Understanding those differences matters because each segment responds to different economic, freight, regulatory, and replacement-cycle drivers. A trailer is a vehicle without motive power designed for carrying property and for being drawn by a motor vehicle.
Dry Vans: Totally enclosed trailer for dry cargo.
Reefer Vans: A refrigerated van trailer. Used for hauling any product that is temperature sensitive, such as food, film, and medications.
Platforms: A trailer chassis consisting of a flat loading deck without permanent sides or roof.
Low Beds: A trailer designed to carry large and heavy loads where loaded height is critical, typically seen moving large construction equipment. MD low bed trailers have a capacity of 25-40 tons, while HD units have a capacity of more than 40 tons.
Dumps: Three types of dump trailers: side, bottom and end. Used in basic industries and construction. Used for aggregates, such as stone, coal and sand.
Tanks: A trailer with a liquid tight vessel to carry liquid or dry bulk freight.
Containers: Containers are the boxes that are used in intermodal service to haul either domestic or international goods. Due to international freight flows, there are no international 20’ or 40’ containers built in North America. The containers produced in the North American market are for domestic freight only and are produced in both dry and refrigerated configurations.
Chassis (aka: container chassis): Chassis are the means by which containerized intermodal freight is delivered from steamships and railroads to customers. A container/chassis combination is basically a two-piece dry van.
Dolly, Converter gear: An auxiliary undercarriage assembly consisting of a chassis, fifth wheel, and tow bar used in combination trailer service.
Many of the factors driving trailer demand are the same that influence Class 8 demand. We encourage you to at least skim the Truck Demand section to gain an appreciation of the macro drivers impacting the supply side of the trailer demand equation.
Which trailer segments drive demand?
Van-type trailers represent the majority of U.S. trailer demand. Dry vans and refrigerated vans typically account for the largest share of production because they support broad freight markets, including retail, consumer goods, food, grocery, and general merchandise movement.
Flatbeds are another major trailer category, tied more closely to industrial production, construction, infrastructure, steel, machinery, and building materials.
Other trailer segments, including tanks, dumps, lowbeds, chassis, containers, dollies, and specialty trailers, are more application-specific and often respond to the economic sectors they serve.
From 2017 to 2021, dry and refrigerated vans accounted for more than 75% of U.S. trailer production, with dry vans representing 61%, refrigerated vans 15%, and flatbeds roughly 9%.
Freight demand is the starting point for trailer demand
Trailer demand begins with freight demand.
When economic activity creates more freight, the market may need more trailers, better utilization of existing trailers, or a combination of both. When freight volumes soften, new trailer demand can weaken and replacement activity may be delayed.
Trailer demand is also connected to Class 8 tractor supply and driver availability. Because trailers are purchased in multiples relative to tractors, changes in tractor capacity, utilization, and fleet strategy can affect trailer-to-tractor ratios and trailer purchasing decisions.
Trailer demand is shaped by:
- Freight volumes and shipment activity
- Carrier profitability and fleet investment
- Class 8 tractor supply
- Driver availability and seated capacity
- Trailer utilization and drop-and-hook operations
- Inventory and warehousing patterns
- Replacement needs for aging equipment
- Segment-specific economic activity
Population, fleet age, and replacement demand
Trailer population and fleet age are important indicators for understanding replacement demand.
When trailer shipments are strong for several years, the total trailer population can grow and average fleet age can decline. A younger fleet may give carriers more flexibility to delay replacement when freight conditions weaken. An older fleet can create more underlying replacement pressure when maintenance costs, reliability, utilization, or regulatory requirements become more difficult to manage.
ACT evaluates population, fleet age, and replacement behavior to understand how much trailer demand may be driven by new freight needs versus replacement of existing equipment.
Dry vans: the largest trailer segment
Dry vans are the largest trailer segment and are closely tied to retail, consumer goods, general freight, warehousing, and inventory activity.
Dry van demand can be influenced by trailer-to-tractor ratios, drop-and-hook operations, e-commerce, warehouse strategy, packaging productivity, and tracking technology. These factors affect how many trailers are needed to support a given amount of freight.
Over time, dry van population growth reflects both freight demand and productivity changes. When fleets can use trailers more efficiently, fewer units may be needed per tractor. When networks require more drop capacity or staging, trailer-to-tractor ratios may rise.
Why trailer-to-tractor ratios matter
Trailer-to-tractor ratios help explain why trailer demand does not move one-for-one with tractor demand.
A fleet may need multiple trailers for every tractor because trailers are used for loading, unloading, staging, drop-and-hook operations, warehousing, and network flexibility. Changes in trailer tracking, warehouse strategy, e-commerce, packaging productivity, and fleet operations can move this ratio over time.
Even small changes in trailer-to-tractor ratios can have a meaningful impact on trailer population and future demand.
Average age and fleet quality
Average fleet age and fleet quality help ACT evaluate replacement pressure.
A younger trailer fleet can make it easier for customers to defer purchases during weaker freight conditions. An older fleet may increase replacement demand as maintenance, reliability, efficiency, or regulatory concerns become more important.
ACT also evaluates late-model equipment as a share of the active population to understand the quality of the trailer fleet and the likelihood that replacement demand may accelerate or slow.
Underlying replacement demand
Past trailer production helps shape future replacement demand.
Large production years eventually create future replacement needs as those trailers age through the fleet. Weak production periods can reduce the number of units reaching replacement age in later years. This is why ACT evaluates historical production, population, fleet age, and fleet quality together when assessing future trailer demand.
Underlying replacement demand is not the same as total demand. Total demand also depends on freight activity, capacity conditions, carrier profitability, financing, regulation, and customer confidence.
Refrigerated vans: stable demand with shorter useful lives
Refrigerated van demand is supported by the steady need to move temperature-controlled freight, including food, produce, dairy, frozen goods, pharmaceuticals, and other sensitive products.
Reefer vans often have shorter useful lives than dry vans because temperature control depends on insulation performance, box integrity, moisture resistance, and refrigeration unit reliability. Over time, insulation can degrade, moisture can reduce efficiency, and refrigeration systems can become less economical to maintain.
These factors create a more consistent replacement need than some other trailer segments, although regulation, food safety requirements, and regional operating rules can also affect demand timing
Flatbeds: tied to industrial and construction activity
Flatbed demand is closely tied to industrial production, steel, machinery, construction, infrastructure, building materials, agriculture, and energy-related freight.
Because these sectors can move differently than consumer goods or refrigerated freight, flatbed demand often follows a different cycle than dry van or reefer demand. When construction, manufacturing, or industrial activity strengthens, flatbed demand may improve. When those sectors weaken, flatbed demand can slow even if other trailer segments remain stable.
Specialty trailers follow their end markets
Specialty trailers are often tied to the specific work they are designed to support.
Examples include:
- Dumps and lowbeds tied to construction, road building, mining, and heavy equipment movement
- Bulk and liquid tanks tied to chemicals, petroleum products, food-grade liquids, energy, and industrial activity
- Grain trailers tied to agricultural conditions and farm-sector profitability
- Chassis and containers tied to intermodal, port, and cross-border freight movement
Because these applications are more specialized, segment-level trailer analysis is important for understanding demand.
Trailer OEMs and market structure
The North American trailer market includes large national OEMs, segment specialists, regional manufacturers, and companies focused on specific trailer applications.
Market structure varies by trailer type. Dry van and refrigerated van production is concentrated among large OEMs, while specialty trailer segments may include more application-specific manufacturers.
ACT tracks trailer OEM activity, production, shipments, orders, backlog, and segment-level demand through its U.S. trailer market intelligence.
According to the 2022 Trailer Output Report by Trailer Body Builders, the top 25 North American truck-trailer OEMS and their 2022 trailer sales are below:
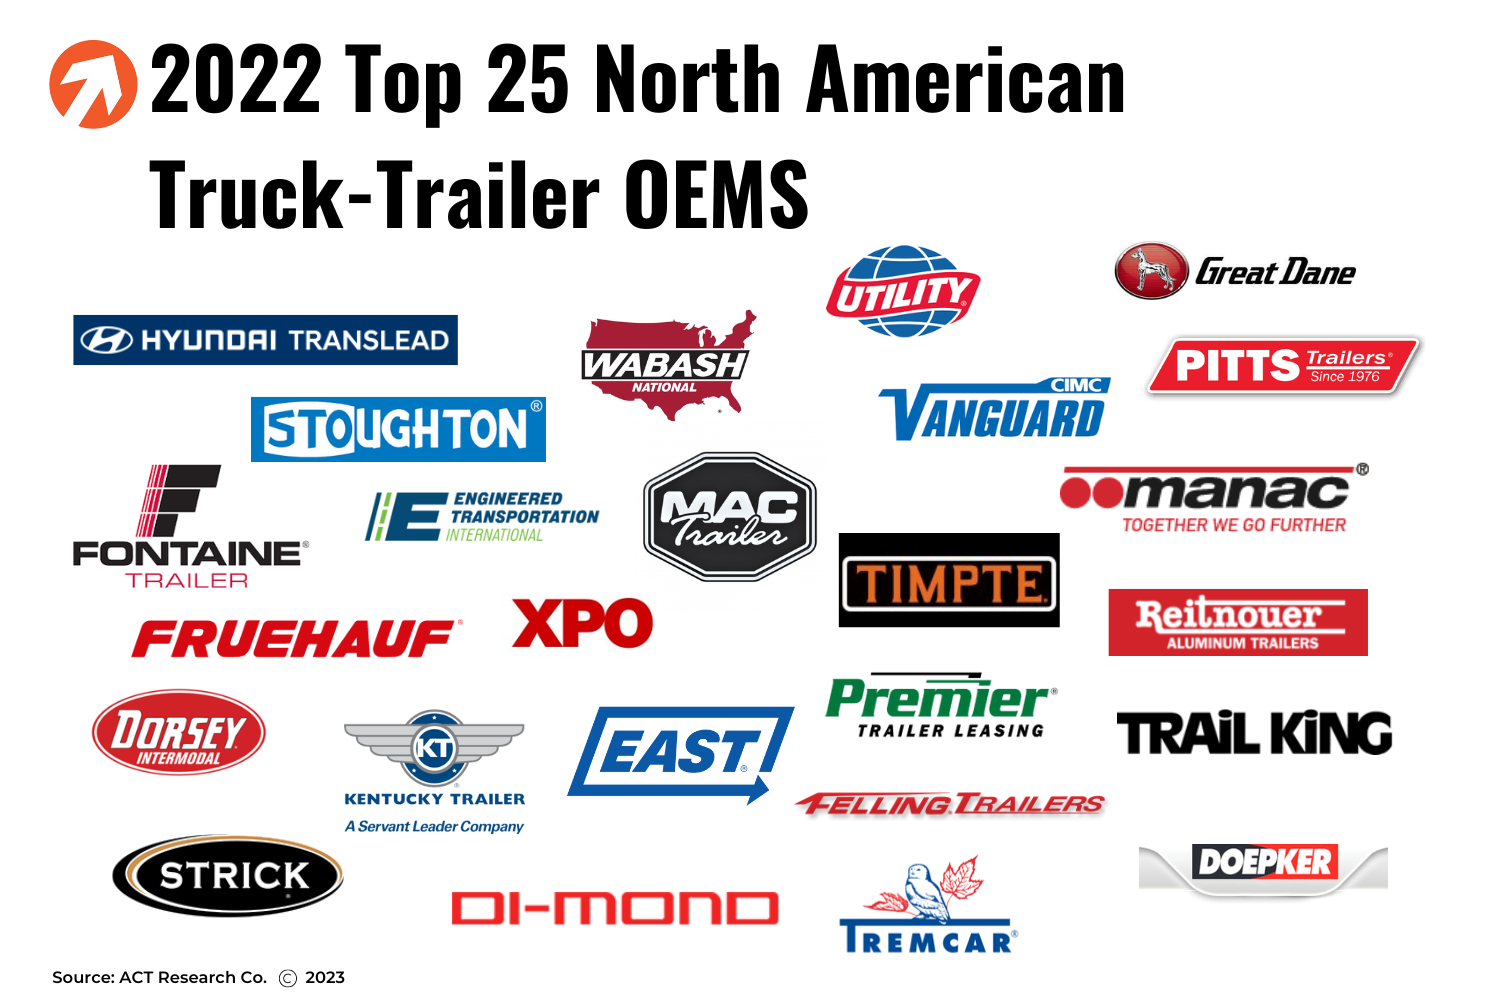
Hyundai Translead - 63,206
Wabash - 51,090
Utility - 50,023
Great Dane - 40,000
Stoughton - 24,750
Vanguard National - 20,563
Pitts Trailers-Dorsey Intermodal - 11,104
Fontaine - 9,182
EnTrans - 8,107
MAC - 7,628
MANAC - 7,450
Fruehauf North America - 5,821
XPO Logistics - 4,705
Timpte - 4,473
Reitnouer - 3,401
Dorsey Trailer - 3,217
Kentucky Trailer - 2,601
East Manufacturing. - 2,425
Premier - 2,318
Trail King - 1,800
Strick Trailers - 1,700
Di-Mond - 1,432
Felling - 1,401
Tremcar - 1,184
Doepker - 1,163
Looking for current U.S. trailer market data?
ACT’s United States Trailers report provides monthly market indicators for U.S. trailer orders, build, shipments, inventory, backlog, cancellations, and segment-level activity.
Trailer market indicators ACT tracks
ACT tracks several monthly indicators to understand trailer demand, production timing, market balance, and cycle movement.
The majority of trailer OEMS submit market indicator data to ACT. We aggregate the data by segment in our reports and provide it back to the market to help provide insights into the health of the current market. Below are those market indicators.
MARKET INDICATORS
Backlog (BL): The backlog is the number of vehicles that have been ordered but have not yet been built. Backlog is calculable: Past backlog + current net orders – current build = new backlog.
Build (BU): Build, or production, pertains to the number of vehicles produced for a given market, NOT the country in which the actual production takes place. When a unit leaves the assembly line it is counted in the build data.
New Orders: New orders are the total number of orders received by the industry each month. Also referred to as gross orders.
Cancellations: Cancellations are units that have been ordered previously and are then canceled. Order and cancellation cannot occur in the same month.
Net Orders: New Orders – Cancellations = Net Orders.
Inventory: Inventory is the number of units that have been built, but for which no factory shipment has yet taken place. Inventory is a calculable number, rather than an additive, number: Past inventory + current build – current factory shipments = current inventory.
Factory Shipments (FS): Units that have been built and have left the factory.

Market Indicators
See how ACT tracks key freight, commercial vehicle, equipment, economic, and survey-based indicators to understand current market conditions and cycle movement.

Used Truck Market Signals
Learn why used truck values, sales activity, inventory, age, and mileage are important signals for freight conditions, carrier behavior, replacement timing, and asset risk.

Explore related trailer and freight market resources
Explore related ACT resources to understand trailer demand, freight conditions, market indicators, used equipment signals, and the broader transportation equipment cycle.
Need deeper trailer market intelligence?
ACT can help you identify the trailer report, component forecast, freight forecast, data resource, or analyst perspective that fits your planning needs.