
Freight Intelligence for Shippers
See where freight rates, volumes, and capacity conditions may be headed — and understand what those signals mean for your budget, bid, pricing, and planning decisions.
ACT Research helps transportation leaders look beyond current market conditions with forward-looking freight forecasts, rate and volume intelligence, and analyst interpretation. Use ACT’s Freight Forecast: Rate & Volume Outlook to better understand where freight markets may be headed, how rate and capacity conditions could change, and what those shifts may mean for your next planning decision.
Get a Freight Forecast PreviewStill reacting to freight market changes after they happen?
Freight markets can shift quickly. Rates firm, capacity tightens, volumes change, and planning assumptions become outdated before teams have time to adjust.
ACT helps shippers, brokers, carriers, and transportation leaders move from reacting to market volatility to planning with a clearer view of what may come next.

Unexpected Rate Movement
Freight costs can shift before budgets, bids, and pricing strategies are ready.

Tighter Capacity Conditions
When available truckload capacity becomes less abundant, service and cost pressures can rise quickly.

Fragmented Market Inputs
Internal spreadsheets, public data, and market headlines rarely provide a complete forward-looking view on their own.

Unclear Planning Assumptions
When forecasts feel disconnected from the market cycle, it becomes harder to defend long-term plans.
September 2026 Update
Chaos Is Cash—For the Shippers Who Prepare
Plan freight decisions with a clearer view of what comes next.
Freight Forecast: Rate & Volume Outlook gives transportation teams a forward-looking view of rate and volume trends so they can plan with more confidence and fewer surprises.
Use ACT’s freight forecasting intelligence to:
- Plan 12–36 months ahead with forward-looking rate and volume forecasts that help strengthen budgets, bid strategies, and long-term assumptions.
- Prepare for procurement conversations with a clearer view of capacity conditions, contract-rate direction, and freight-cycle timing.
- Identify risk earlier by tracking freight, capacity, economic, and equipment-cycle signals before they affect cost, service, or margin.
- Support better operating decisions with intelligence that connects market direction to service expectations, routing strategy, carrier relationships, and resource planning.
Freight forecasts backed by experience, data, and analyst interpretation.
ACT’s freight forecasts combine proprietary market data, proven methodology, and analyst interpretation to help transportation leaders understand where the freight cycle may be headed.
For more than 35 years, ACT has helped customers evaluate transportation markets with a disciplined, forward-looking view.

35+ Years of Industry Expertise

Proprietary Data

Methodology
Assuring rail equipment capacity for our intermodal stakeholders is imperative at TTX Company. Meeting this goal requires accurate freight demand forecasting which, in turn, necessitates an understanding of market conditions and issues. ACT Research’s monthly Freight Forecast complements our internal research and analysis by providing keen insight on demand drivers, as well as emerging and evolving trends. The report’s content is well-written, and the information provided is organized and easy to access and interpret.

Frank Adcock
AVP Marketing, TTX Company

What you get with ACT’s Freight Forecast: Rate & Volume Outlook
ACT’s Freight Forecast: Rate & Volume Outlook helps customers understand rate and volume direction across key freight markets and connect that outlook to planning decisions.
Inside the forecast, your team gets a forward-looking view supported by ACT’s market data, forecasting methodology, partner intelligence, and analyst interpretation.
- 36-month freight outlook: Evaluate rate and volume trends over a three-year horizon to support near-term planning and longer-term market assumptions.
- Class 8 tractor supply context: Connect freight conditions to tractor supply, equipment demand, and capacity signals using ACT’s commercial vehicle market expertise.
- Connected market view: Bring together freight data, economic indicators, capacity signals, and analyst interpretation to better understand the full market picture.
- DAT Freight & Analytics partnership: ACT’s partnership with DAT Freight & Analytics provides additional visibility into spot and contract rates, volumes, loads, and equipment postings to support a more detailed view of freight market trends.

Updated September 28, 2026
Market Update - Shippers
September 2026 Update
Transportation Planning Requires a Clearer View of Rates, Fuel, and Available Capacity
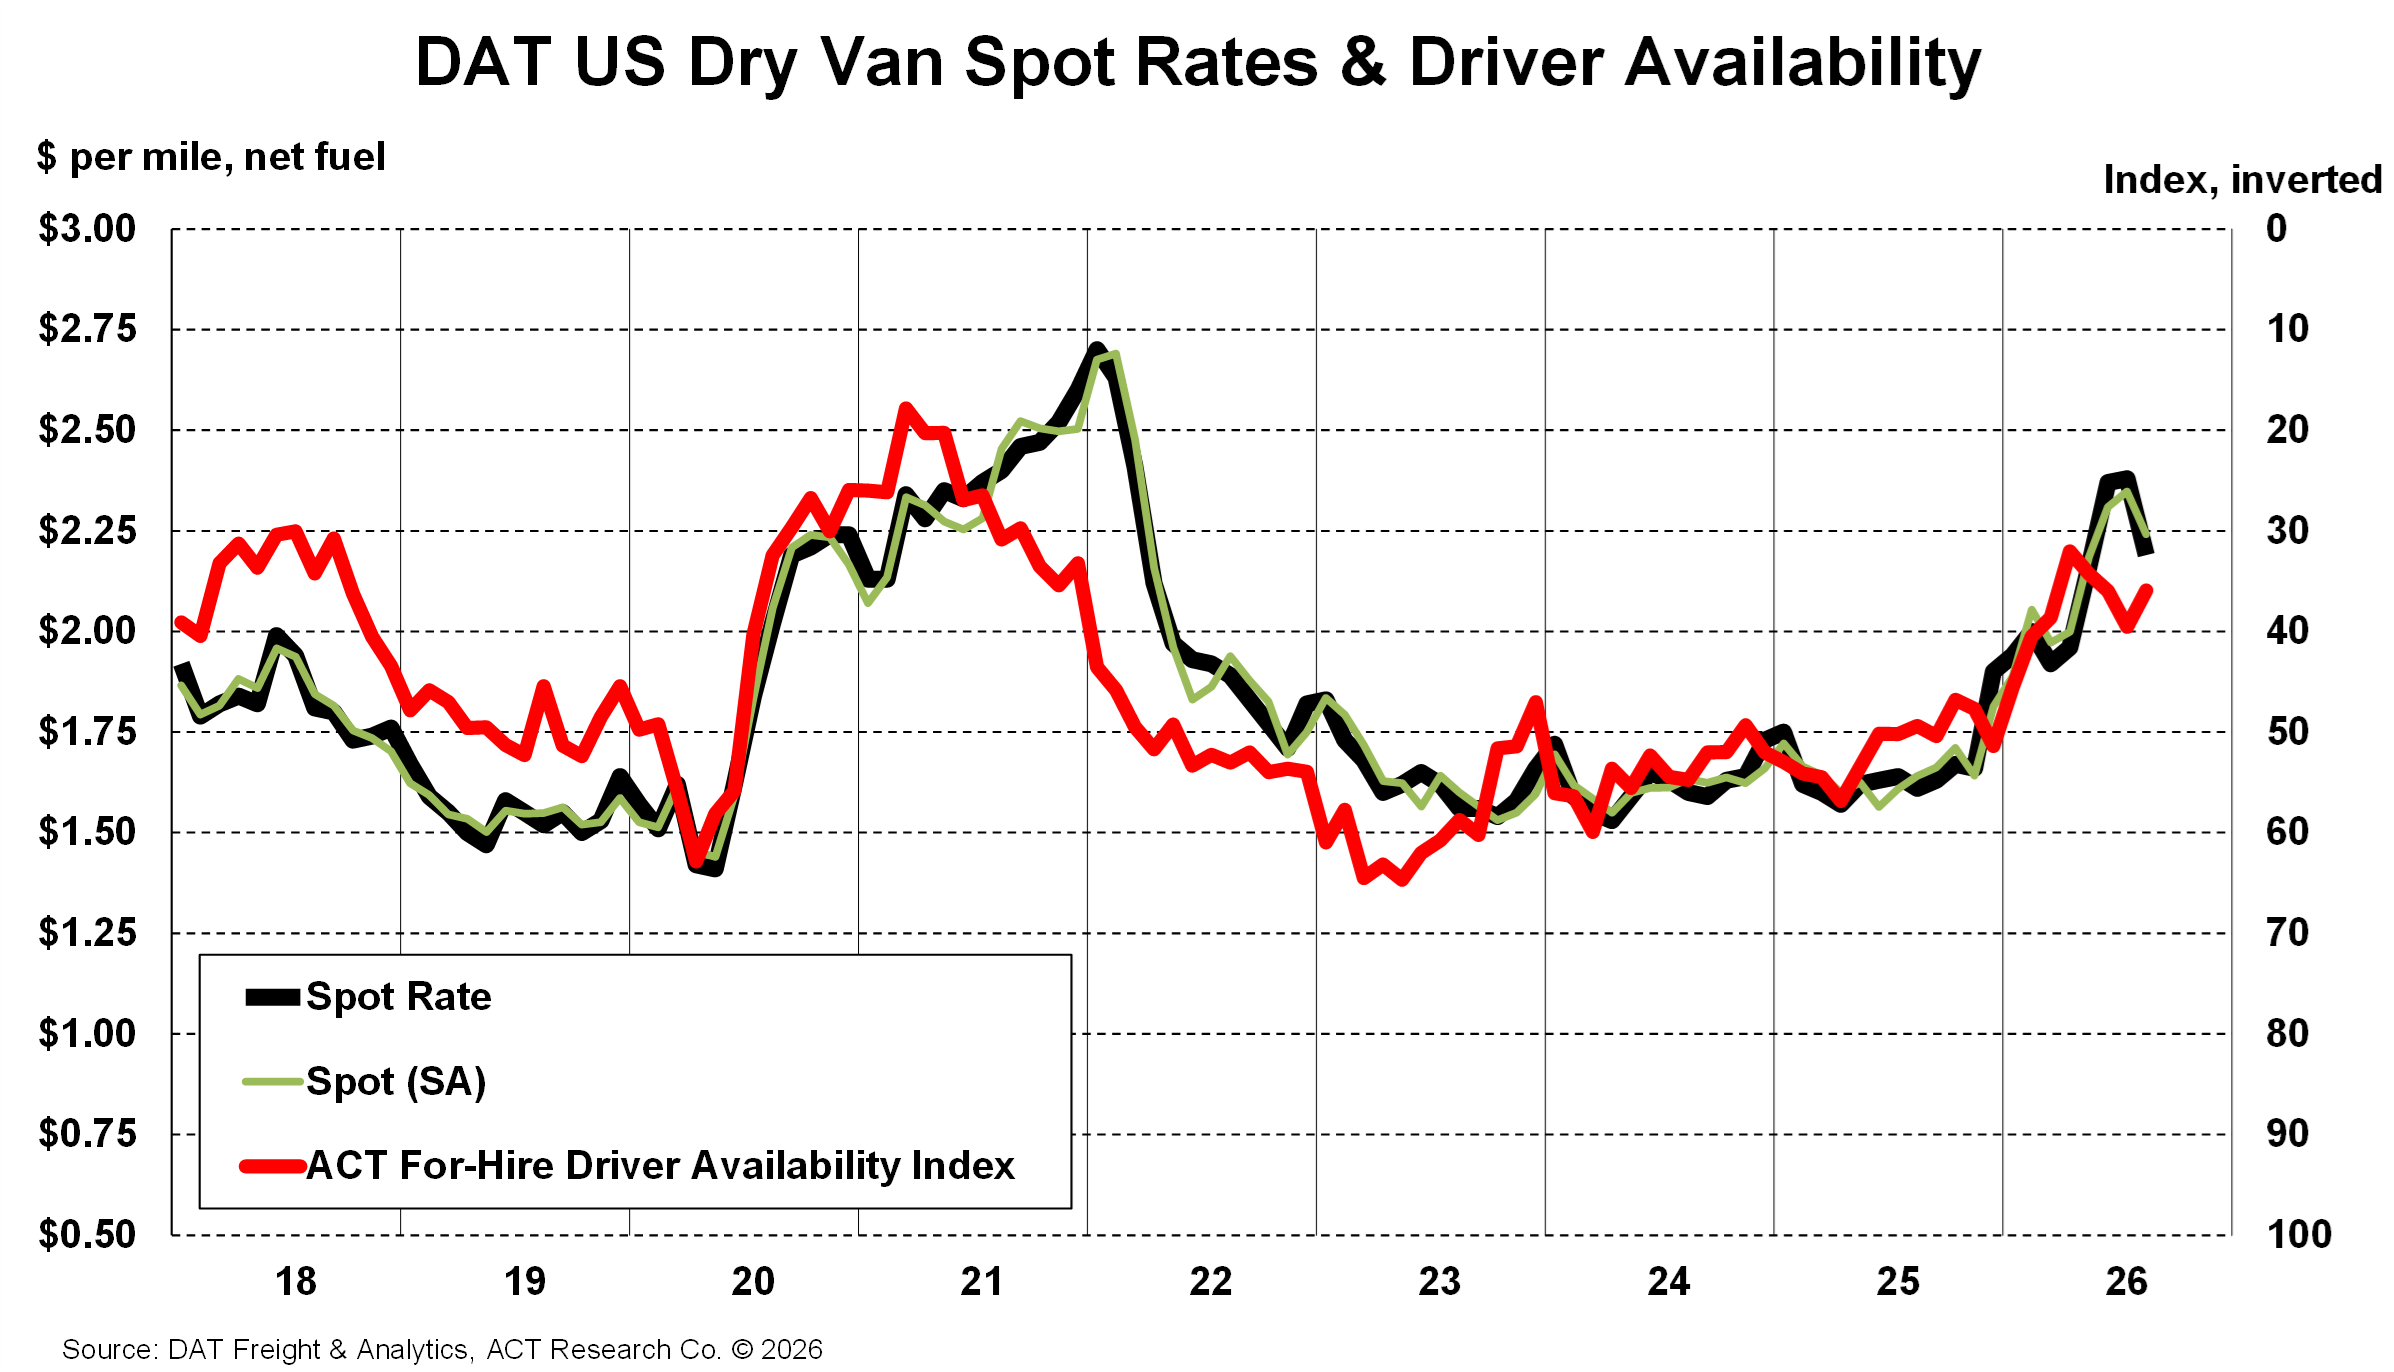
September’s freight outlook gives shippers and private fleets more evidence of improving demand, but capacity remains an important constraint. ACT’s latest Freight Forecast shows broader gains in shipment indicators while driver availability tightened again in August.
Spot rates excluding fuel declined during the month, while aggregate contract rates held steady. Part of the spot decline reflected seasonal moderation, and part reflected carriers’ incomplete recovery of higher diesel costs. Lower rates measured excluding fuel therefore do not necessarily translate into equivalent savings on the total freight bill.
Budget Against the Full Transportation Cost
Transportation budgets should distinguish base rates, fuel, accessorials, shipment mix, and the cost of service exceptions. A favorable change in one component can be offset elsewhere, particularly if more freight moves outside the routing guide or requires expedited coverage.
Equipment markets also differed. August reefer contract rates increased, dry van rates were flat, and flatbed rates eased slightly. Domestic and cross-border lanes can experience different conditions within the same network.
For procurement teams, national benchmarks provide useful context when aligned with equipment, geography, timing, and service. Their value increases when combined with actual tender acceptance, carrier performance, and spot-market exposure.
Evaluate Capacity Alongside Price
The beginning of a capacity response does not immediately eliminate service risk. New equipment purchases include replacement, and driver availability influences how much equipment can be used productively.
Shippers should evaluate whether current carrier allocations and contingency plans remain appropriate as demand improves. Seasonal easing can create opportunities to review pricing and coverage, but it should be assessed against the requirements of individual lanes.
Intermodal may provide an alternative where network access, transit time, and shipment characteristics align. Tight truckload conditions support its competitive position, although any change in mode should be evaluated on total cost and service performance.
Private-Fleet Decisions Have Different Economics
For private fleets, the comparison between internal capacity and purchased transportation extends beyond a market rate per mile. Utilization, empty miles, driver availability, maintenance, equipment replacement, and service requirements all affect the economics.
Improving for-hire conditions may change the cost of overflow capacity, while higher equipment and financing costs influence internal investment. Replacement purchases should therefore be considered alongside the fleet’s operating role and the availability of outside alternatives.
ACT’s Freight Forecast and North America Commercial Vehicle OUTLOOK connect transportation-market conditions with equipment planning. That perspective helps shippers and private fleets evaluate budgets, procurement timing, modal choices, and the balance between owned and purchased capacity.
Freight's supply-driven upturn: How long will rates rise?
Freight Forecast FAQs
ACT combines freight-market data, economic analysis, Class 8 supply modeling, and analyst interpretation to forecast rate, volume, and capacity conditions. Its partnerships with DAT Freight & Analytics and Cass Information Systems add market inputs to that analysis. Forecasts are updated monthly as conditions and underlying data change.
Absolutely. Click here to get your exclusive Sample Insights Preview. See the depth and format of our reports.
ACT’s freight rate and volume forecasts are updated monthly. Updates are typically published on or near the 13th of each month, depending on the calendar and the release timing of partner data.
ACT’s Freight Forecast provides a rolling outlook extending up to 36 months ahead, with monthly updates to support transportation budgets, bid strategies, and longer-term planning. Coverage varies by forecast measure. Review the current report’s tables for the specific periods covered.

Ready to plan freight decisions with more confidence?
ACT’s Freight Forecast: Rate & Volume Outlook helps your team understand where freight rates, volumes, and capacity conditions may be headed — and what those shifts may mean for budgets, bids, pricing, procurement, and long-term planning.
Use forward-looking freight intelligence and analyst interpretation to move from reacting to market changes to planning around them.