
Freight & Equipment Market Intelligence for Carriers and Fleets
Connect freight, rate, capacity, and equipment signals to better fleet planning decisions.
ACT Research helps carriers and fleets understand where freight markets are headed, how capacity is shifting, and what those signals may mean for pricing, utilization, replacement timing, and equipment strategy. With forward-looking forecasts, market data, and analyst interpretation, ACT gives your team a clearer view of the freight and equipment cycle — so you can plan with confidence instead of reacting to the market after it moves.
Get Transportation IntelligencePlan beyond the next load. Understand the cycle behind your next decision.
Carrier performance is shaped by more than today’s freight rate. Rate direction, capacity, driver availability, Class 8 tractor supply, used truck values, equipment demand, and broader economic conditions all influence how and when fleets should act.
ACT helps carriers and fleets connect those signals into a forward-looking market view that supports smarter decisions around pricing, network strategy, fleet replacement, capital planning, and risk management.
Rate & Capacity Planning
Understand freight-rate direction, capacity conditions, and market-cycle timing so your team can make more confident pricing and planning decisions.
Fleet & Equipment Strategy
Connect freight demand, utilization, Class 8 tractor supply, used truck values, and replacement timing to better fleet strategy.
Risk & Scenario Planning
Evaluate market disruptions, economic indicators, and cycle shifts before they create costly surprises.
Operational Decision Support
Use supply-demand intelligence to support decisions around customer mix, lane strategy, service commitments, and asset utilization.

Forecasts your fleet planning team can defend.
ACT Research’s 2024 forecasts for the Cass Truckload Linehaul Index® were 98.8% accurate on average over the past 18 months and were spot on from 13 months out.
ACT’s freight forecasts help carriers evaluate where rates, volumes, and market conditions may be headed — and how those changes may affect fleet planning, pricing, capacity, and investment decisions.
When your team needs to defend assumptions around the market ahead, ACT provides forward-looking intelligence backed by data, methodology, and analyst interpretation.
Connect supply, demand, and equipment signals before the market shifts.
Carriers need to anticipate market shifts, manage capacity, price with discipline, and make informed decisions about fleet size, replacement timing, and customer strategy.
There are many sources that show what has already happened in freight markets. ACT helps carriers look ahead by connecting freight demand, rate direction, Class 8 tractor supply, used truck values, economic indicators, and analyst perspective into a more complete view of the market cycle.
With ACT Research, your team can use:
- Class 8 tractor forecasts to better understand active tractor capacity and future equipment supply.
- DAT spot and contract rate forecasts to evaluate dry van, refrigerated, and flatbed rate direction.
- Cass-powered freight volume and mode insights to understand broader freight movement across truckload, LTL, and intermodal markets.
- Freight-weighted economic indicators to connect consumer demand and economic activity to freight and fleet planning.
- ACT analyst interpretation from a team with more than 250 years of combined industry experience.
Before You Add Capacity: Freight Signals Carriers Should Watch
Fleet expansion should not be based on a single month of stronger rates, higher load volumes, or improved customer activity. Carriers need confirmation across freight demand, pricing, capacity, operating economics, and equipment-market conditions before committing capital to additional tractors, trailers, and drivers.
1. Freight Demand and Customer Commitments
Improving shipment volumes can indicate that the freight cycle is strengthening, but not every increase is durable. Seasonal activity, inventory adjustments, modal shifts, or short-term disruptions can temporarily lift freight volumes.
Carriers should evaluate whether higher load activity is sustained across multiple months, supported by committed customer freight, and confirmed by freight-generating economic indicators such as industrial production, consumer goods demand, imports, exports, and inventory activity.
2. Spot and Contract Rate Direction
Spot rates often react first when the freight market begins to tighten. Contract rates typically adjust later as annual bids, customer agreements, and routing-guide strategies reset.
A stronger case for fleet growth develops when spot-rate improvement persists, contract pricing begins to follow, and the relationship between rates and operating costs supports sustainable margin improvement. A temporary spot-rate increase alone may not justify a long-term capacity investment.
3. Available Capacity and Driver Supply
Rates can rise because freight demand is improving, available capacity is contracting, or both. Understanding the source of market tightening is essential.
Carriers should monitor fleet exits, driver availability, equipment utilization, load-to-truck conditions, and the amount of tractor capacity likely to enter the market. Adding equipment without the drivers, customer demand, or operating structure needed to utilize it can increase costs without producing profitable growth.
4. Carrier Economics and Equipment Costs
Improving revenue does not automatically translate into stronger returns. Fleet-growth decisions should account for insurance, maintenance, labor, fuel, financing, and equipment-acquisition costs.
Carriers should evaluate whether anticipated utilization and revenue will support the complete cost of adding capacity. New-truck pricing, used-truck values, financing conditions, maintenance exposure, and the expected residual value of equipment can materially change the economics of an expansion decision.
5. Freight-Cycle and Equipment-Supply Conditions
Fleet investment tends to increase as rates, utilization, and carrier profitability improve. When many carriers respond to the same signals at the same time, new capacity can eventually grow faster than freight demand.
Understanding the market’s position in the truckload cycle can help carriers distinguish an early growth opportunity from a late-cycle overexpansion risk. Class 8 production, tractor orders, backlogs, fleet profitability, used-equipment values, and replacement activity provide important context for how quickly capacity may return to the market.
Look for Confirmation Across the Market
No single freight indicator provides a complete fleet-growth signal. A more defensible decision develops when multiple conditions align:
- Freight volumes and customer commitments show sustained improvement.
- Spot-rate gains begin to carry into contract pricing.
- Equipment utilization and operating margins strengthen.
- Driver availability supports the planned capacity addition.
- Equipment costs and financing remain supportable.
- Tractor-supply and fleet-investment trends do not indicate that excess capacity is forming.
- Forward forecasts support the expected timing and durability of the market change.
The absence of confirmation does not necessarily mean a carrier should stop investing. It may indicate that replacement, selective growth, customer-specific capacity, or phased investment is more appropriate than broad fleet expansion.
Connect Current Freight Conditions to What Comes Next
Current and historical market data help carriers understand what has already changed. ACT Research adds the forward-looking perspective needed to evaluate whether those changes are likely to continue.
ACT’s Freight Intelligence incorporates freight volumes, spot and contract rates, capacity conditions, freight-weighted economic indicators, carrier behavior, and analyst interpretation. Data and market visibility from Cass Information Systems and DAT Freight & Analytics help establish current freight conditions, while ACT’s Freight Forecast: Rate & Volume Outlook provides a 6–36-month view of where rates, volumes, and capacity conditions may be headed.
ACT then connects that freight outlook with Commercial Vehicle Intelligence and Equipment Market Intelligence, helping carriers evaluate how freight demand, Class 8 tractor supply, equipment production, replacement timing, and used-truck values may affect fleet strategy.
This connected view helps carrier leadership teams make more informed decisions about:
- Fleet size and selective capacity growth
- Tractor and trailer replacement timing
- Customer and lane strategy
- Pricing and contract negotiations
- Driver and equipment requirements
- Capital planning and market risk

Three strengths behind ACT’s carrier intelligence
ACT’s freight and carrier-focused intelligence combines proprietary data, disciplined methodology, and experienced analyst interpretation to help carriers understand not only what changed in the market, but what it may mean for the decisions ahead.
- ACT Proprietary Data
- ACT Methodology
- ACT Human Intelligence

ACT Proprietary Data
ACT’s market view begins with direct visibility into the freight, equipment, and commercial vehicle signals that shape transportation planning decisions.
By tracking market indicators across commercial vehicles, freight, trailers, used equipment, and broader economic activity, ACT helps customers understand what is changing, how signals connect, and what those shifts may mean for the road ahead.

ACT Methodology
ACT’s forecasting methodology is built on decades of market-cycle experience, industry relationships, historical data, and disciplined analysis.
We connect freight demand, equipment supply, economic activity, production trends, used equipment values, regulatory factors, and customer behavior to help customers evaluate the market with a balanced, forward-looking view.

ACT Human Intelligence
ACT’s analysts bring deep experience across freight, equipment, commercial vehicle, used truck, trailer, regulatory, and economic markets.
We do not simply report the data. We interpret what market signals may mean, how they connect across the transportation cycle, and what decisions they may help inform.
Use market intelligence to make stronger fleet decisions.

Predictive Insights
Understand where freight rates, volumes, and capacity conditions may be headed so your team can prepare before market changes affect pricing, utilization, and profitability.

Strategic Planning
Use forward-looking market analysis to support decisions about customer mix, fleet size, replacement timing, capital investment, and long-term growth strategy.

Risk Mitigation
Identify market, capacity, economic, and equipment-cycle risks earlier so your team can build more resilient plans and avoid being caught off guard.

Operational Efficiency
Connect supply-demand conditions, rate trends, and equipment signals to decisions around network balance, service commitments, lane strategy, and asset utilization.
ACT Research is one of the best resources you can have to make those accurate forecasts. ACT has allowed us to take what we know from our 20-plus years of business in freight brokerage and allowed us to quantify those feelings and allowed us to set the course for the business that we felt was appropriate but gave us the data to back those decisions and made us smarter in the process as well.

Christopher Thornycroft
Redwood Logistics
Updated August 28, 2026
Market Update - Carriers
August 2026 Update
For-Hire Carriers Face a Crossroads: Tight Capacity, Rising Rates, and Cost Discipline
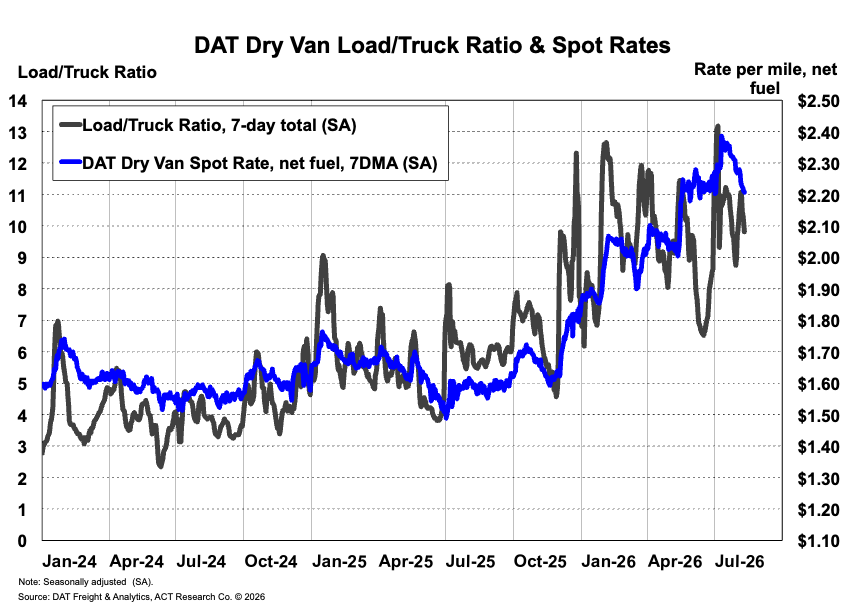
August brings a more constructive but still challenging operating environment for for-hire carriers. ACT’s latest Freight Forecast shows that constrained capacity and regulatory enforcement are supporting sharply higher spot rates, with pricing strength moving more clearly into contract markets. Dry van, reefer, and flatbed spot rates, excluding fuel, were 41% to 47% higher year over year in July, while aggregate contract rates increased 17%.
Carriers are benefiting from reduced excess capacity and improved pricing leverage, but higher revenue does not automatically translate into stronger margins. Insurance, labor, equipment, maintenance, fuel, financing, regulatory compliance, and other operating costs remain substantial constraints. The current environment favors yield protection, network balance, customer selectivity, equipment utilization, and careful reinvestment—not capacity additions made ahead of durable demand confirmation.
Class 8 Orders Signal a Stronger Supply-Driven Upturn
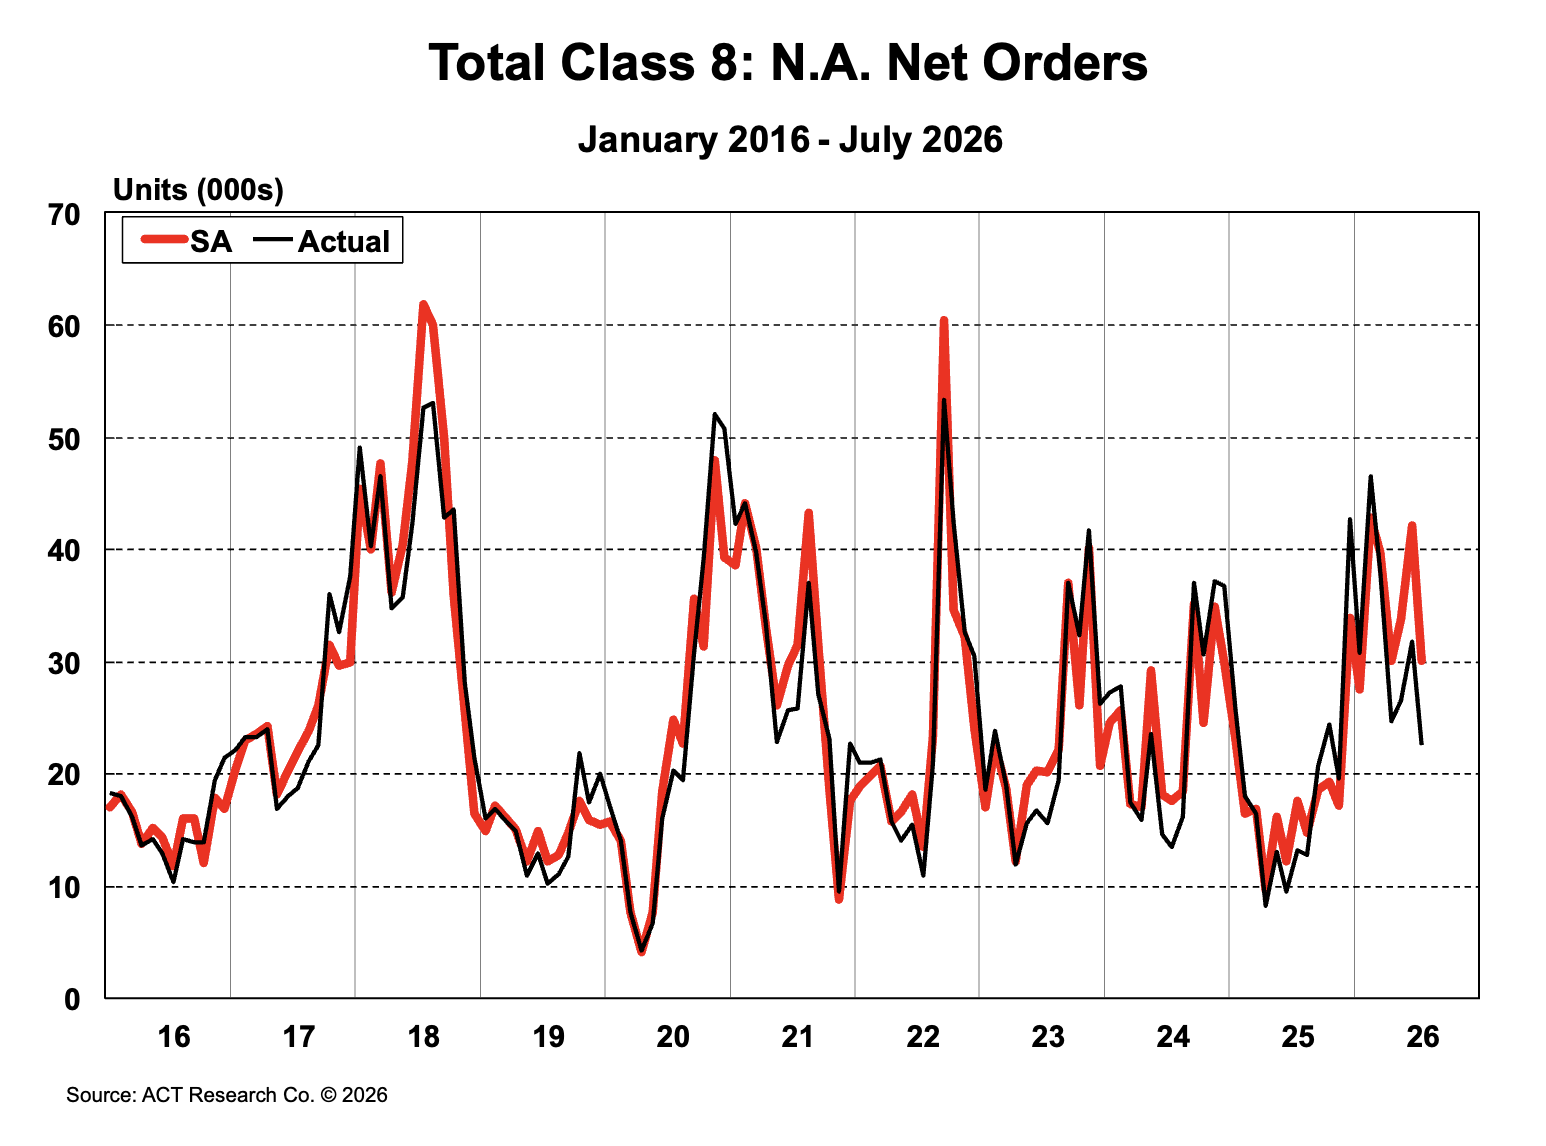
Class 8 order activity remained strong in July. North American Class 8 orders increased 71% year over year, with tractor orders rising 103%. Tighter truckload capacity, stronger freight rates, improving carrier profitability, replacement needs, and EPA 2027 planning continue to support equipment demand.
Orders declined 29% sequentially on a seasonally adjusted basis, but the decrease primarily reflected limited remaining 2026 production availability rather than a sudden weakening in fleet demand. ACT estimates that demand for the remaining build slots exceeds available capacity.
Class 8 backlogs ended July at 182,817 units, equal to approximately 8.9 months of production on a seasonally adjusted basis and well above the historical average. Third- and fourth-quarter build plans moved modestly lower as manufacturers assessed how quickly production could ramp.
Retail activity also improved. Class 8 sales increased 1.5% year over year, while tractor sales rose 8.2%. July marked the second consecutive month in which Class 8 retail sales exceeded estimated replacement demand after remaining below replacement during the first five months of 2026.
For fleet planning teams, the improving environment supports more productive replacement, trade-cycle, and equipment-availability discussions. Purchasing should remain tied to profitability, financing conditions, total cost of ownership, maintenance exposure, and confidence that higher freight rates will persist long enough to support the investment.
Profitability Hinges on Execution as Pricing Floors Reset Higher
Carrier profitability is increasingly tied to execution as pricing conditions improve. Spot rates continue to lead the cycle, while contract pricing is responding more quickly as shorter agreements and frequent mini-bids compress the traditional lag between transactional and negotiated rates.
ACT’s August Freight Forecast shows aggregate DAT contract rates, excluding fuel, increased eight cents in July to $2.50 per mile and were 17% above year-ago levels. Aggregate spot rates remained five cents above contract rates on a nominal basis and two cents higher on a seasonally adjusted basis, signaling acute market tightness.
The pricing pendulum has shifted from shippers toward fleets following the severe 2023–2025 carrier-profitability downcycle. Publicly traded truckload carrier margins improved to a nearly three-year high during the second quarter of 2026, supporting stronger equipment demand and replacement confidence.
The demand-side qualification remains important. Freight activity is improving in pockets, and private fleet contraction is shifting some freight back toward the for-hire market. However, ACT lowered its freight-volume outlook as higher interest rates, elevated fuel prices, slower job growth, and weak consumer fundamentals pressured broader demand.
Carriers maintaining a relative advantage should continue focusing on lane discipline, customer mix, empty-mile reduction, equipment utilization, driver productivity, and pricing quality. In a tighter market, modest improvements in network balance and asset productivity can create meaningful margin benefits—but only if carriers resist adding fixed costs faster than revenue quality improves.
EPA 2027: Demand Support, but Cost and Timing Risks Remain
EPA 2027 remains an important planning consideration for carriers. The EPA’s proposed rule retains the underlying low-NOx technology requirements while introducing nonconformance penalties and potentially extending warranty and useful-life requirements to 2030.
The proposed penalty structure may produce a more staggered equipment transition than a traditional prebuy-and-payback cycle. Some manufacturers and buyers may choose engines subject to nonconformance penalties rather than move immediately to full compliance, while others may accelerate replacement before equipment costs rise further.
The challenge is balancing equipment optionality with capital discipline. Firmer freight rates and improving carrier profitability support greater confidence, but elevated truck prices, tariffs, financing costs, insurance expenses, and uneven freight demand continue to argue against aggressive commitments.
Fleets should evaluate replacement timing, financing flexibility, maintenance and downtime exposure, equipment specifications, manufacturer engine strategies, and the operating economics of available choices. The right decision will vary based on fleet age, utilization, cash flow, trade values, regulatory exposure, and access to capital.
Outlook: A More Constructive but Uneven Market
ACT’s August reports point to a for-hire carrier market operating in a more constructive, supply-driven upturn. Spot rates remain sharply higher, contract pricing is accelerating, equipment capacity remains constrained, and private fleet contraction is returning some freight to the for-hire market.
The market is also entering a transition. Driver availability has shown signs of stabilizing as higher pay attracts drivers, while tractor sales are moving above replacement requirements and should begin adding fleet capacity. These developments are expected to slow the rate trajectory.
Freight demand remains uneven, and embedded cost inflation continues to limit margin expansion. The easing seen in early August should therefore be viewed as a seasonal lull within a still-tight market—not automatically as a return to the excess-capacity conditions of the prior downcycle.
The practical takeaway remains discipline. Carriers that protect yield, improve network quality, manage driver availability, time equipment purchases carefully, control fixed costs, and preserve liquidity will be better positioned as the market continues to rebalance through the second half of 2026 and into 2027.
Freight's supply-driven upturn: How long will rates rise?

Why carriers and fleets choose ACT Research
Carrier decisions depend on more than one data point. ACT combines direct market data, proven methodology, analyst expertise, forecast accuracy, and trusted industry relationships to help carriers understand the freight and equipment signals shaping the market ahead.
- Proprietary Data
- Methodology
- Human Intelligence
- Track record of forecast accuracy and industry use
- Trusted by transportation, manufacturing, leasing, finance, and investment leaders
Market guidance for carrier planning decisions
ACT helps carriers understand the market signals that affect fleet planning, pricing, capacity management, and strategic growth.
Our intelligence supports teams responsible for finance, pricing, equipment, procurement, market analysis, and executive planning with a clearer view of freight rate direction, capacity trends, equipment supply, and broader transportation market conditions.
With ACT Research, carrier teams can:
- Make more informed decisions with forward-looking market analysis and forecasts.
- Connect freight conditions to equipment and replacement planning.
- Evaluate pricing, procurement, and customer strategy with stronger market context.
- Identify risk and opportunity earlier in the freight and equipment cycle.
- Support financial planning with intelligence your team can defend.
Ready to connect freight conditions to your next fleet decision?
ACT helps carriers and fleets understand the freight, capacity, and equipment signals shaping the market ahead. Whether your team is planning pricing strategy, fleet replacement, capital investment, procurement, or future capacity, ACT can help you build a clearer market view.
Use ACT’s forward-looking intelligence and analyst perspective to move from reacting to market conditions to planning around them.
- Make stronger strategic decisions with current market analysis and forward-looking forecasts.
- Evaluate pricing and procurement strategy with better visibility into rates, capacity, and freight-cycle timing.
- Connect tractor supply to fleet planning with Class 8 order, build, sales, and population data.
- Improve replacement planning with intelligence on equipment demand and used truck values.
- Spot risks and opportunities earlier across freight, economic, regulatory, and equipment-cycle signals.
- Support financial plans with defensible assumptions for budget, executive, and long-term planning discussions.
We use this data [from ACT Research] to extract and share these insights with our carriers and shippers…We also use this data in building our internal dashboards, key variables we track, and we found out that a lot of the data points we receive from ACT Research are actually very relevant to our macroeconomic analysis in general.

Mazen Danaf
Uber Freight

Trusted by transportation and commercial vehicle leaders for more than 35 years.
ACT serves more than 400 customers across the freight, transportation, commercial vehicle, equipment, finance, and investment markets.
- Truck OEMs
- Trailer OEMs
- Tier 1 Suppliers
- Tier 2 Suppliers
- Rental & Leasing
- Carriers & Fleets
- Shippers
- Brokers
- Dealers
- Finance & Capital Markets
- Investors
Frequently Asked Questions
ACT’s freight rate and volume forecasts are updated monthly. Updates are typically published on or near the 13th of each month, depending on the calendar and the release timing of partner data.
ACT Research agreements include up to four user seats with portal access. Additional seats may be purchased for an additional per-person fee.
ACT Research service agreements are typically 12 months from the date of agreement. Customers receive access to insights and downloadable files through the ACT Research portal.
ACT’s freight rate forecast provides a three-year outlook, broken into monthly periods and updated monthly.
ACT receives Class 8 tractor data directly from North American OEMs. This includes backlog, build, new orders, cancellations, net orders, inventory, and retail sales data that supports ACT’s view of tractor supply and freight-market capacity. The current page notes this OEM data has been provided since 1986.

Ready to connect freight conditions to your next fleet decision?
ACT helps carriers and fleets understand the freight, capacity, and equipment signals shaping the market ahead. Whether your team is planning pricing strategy, fleet replacement, capital investment, or future capacity, ACT can help you build a clearer market view.