
Dry Van Rates
Dry Van Freight Rates: Spot & Contract Market Trends - September 2026
ACT Research provides data-driven insight into dry van spot and contract rate movements, helping industry leaders understand pricing trends and freight market conditions.
Dry Van Truckload (TL) Sector
September 2026 Update
September 28, 2026
Spot Rates
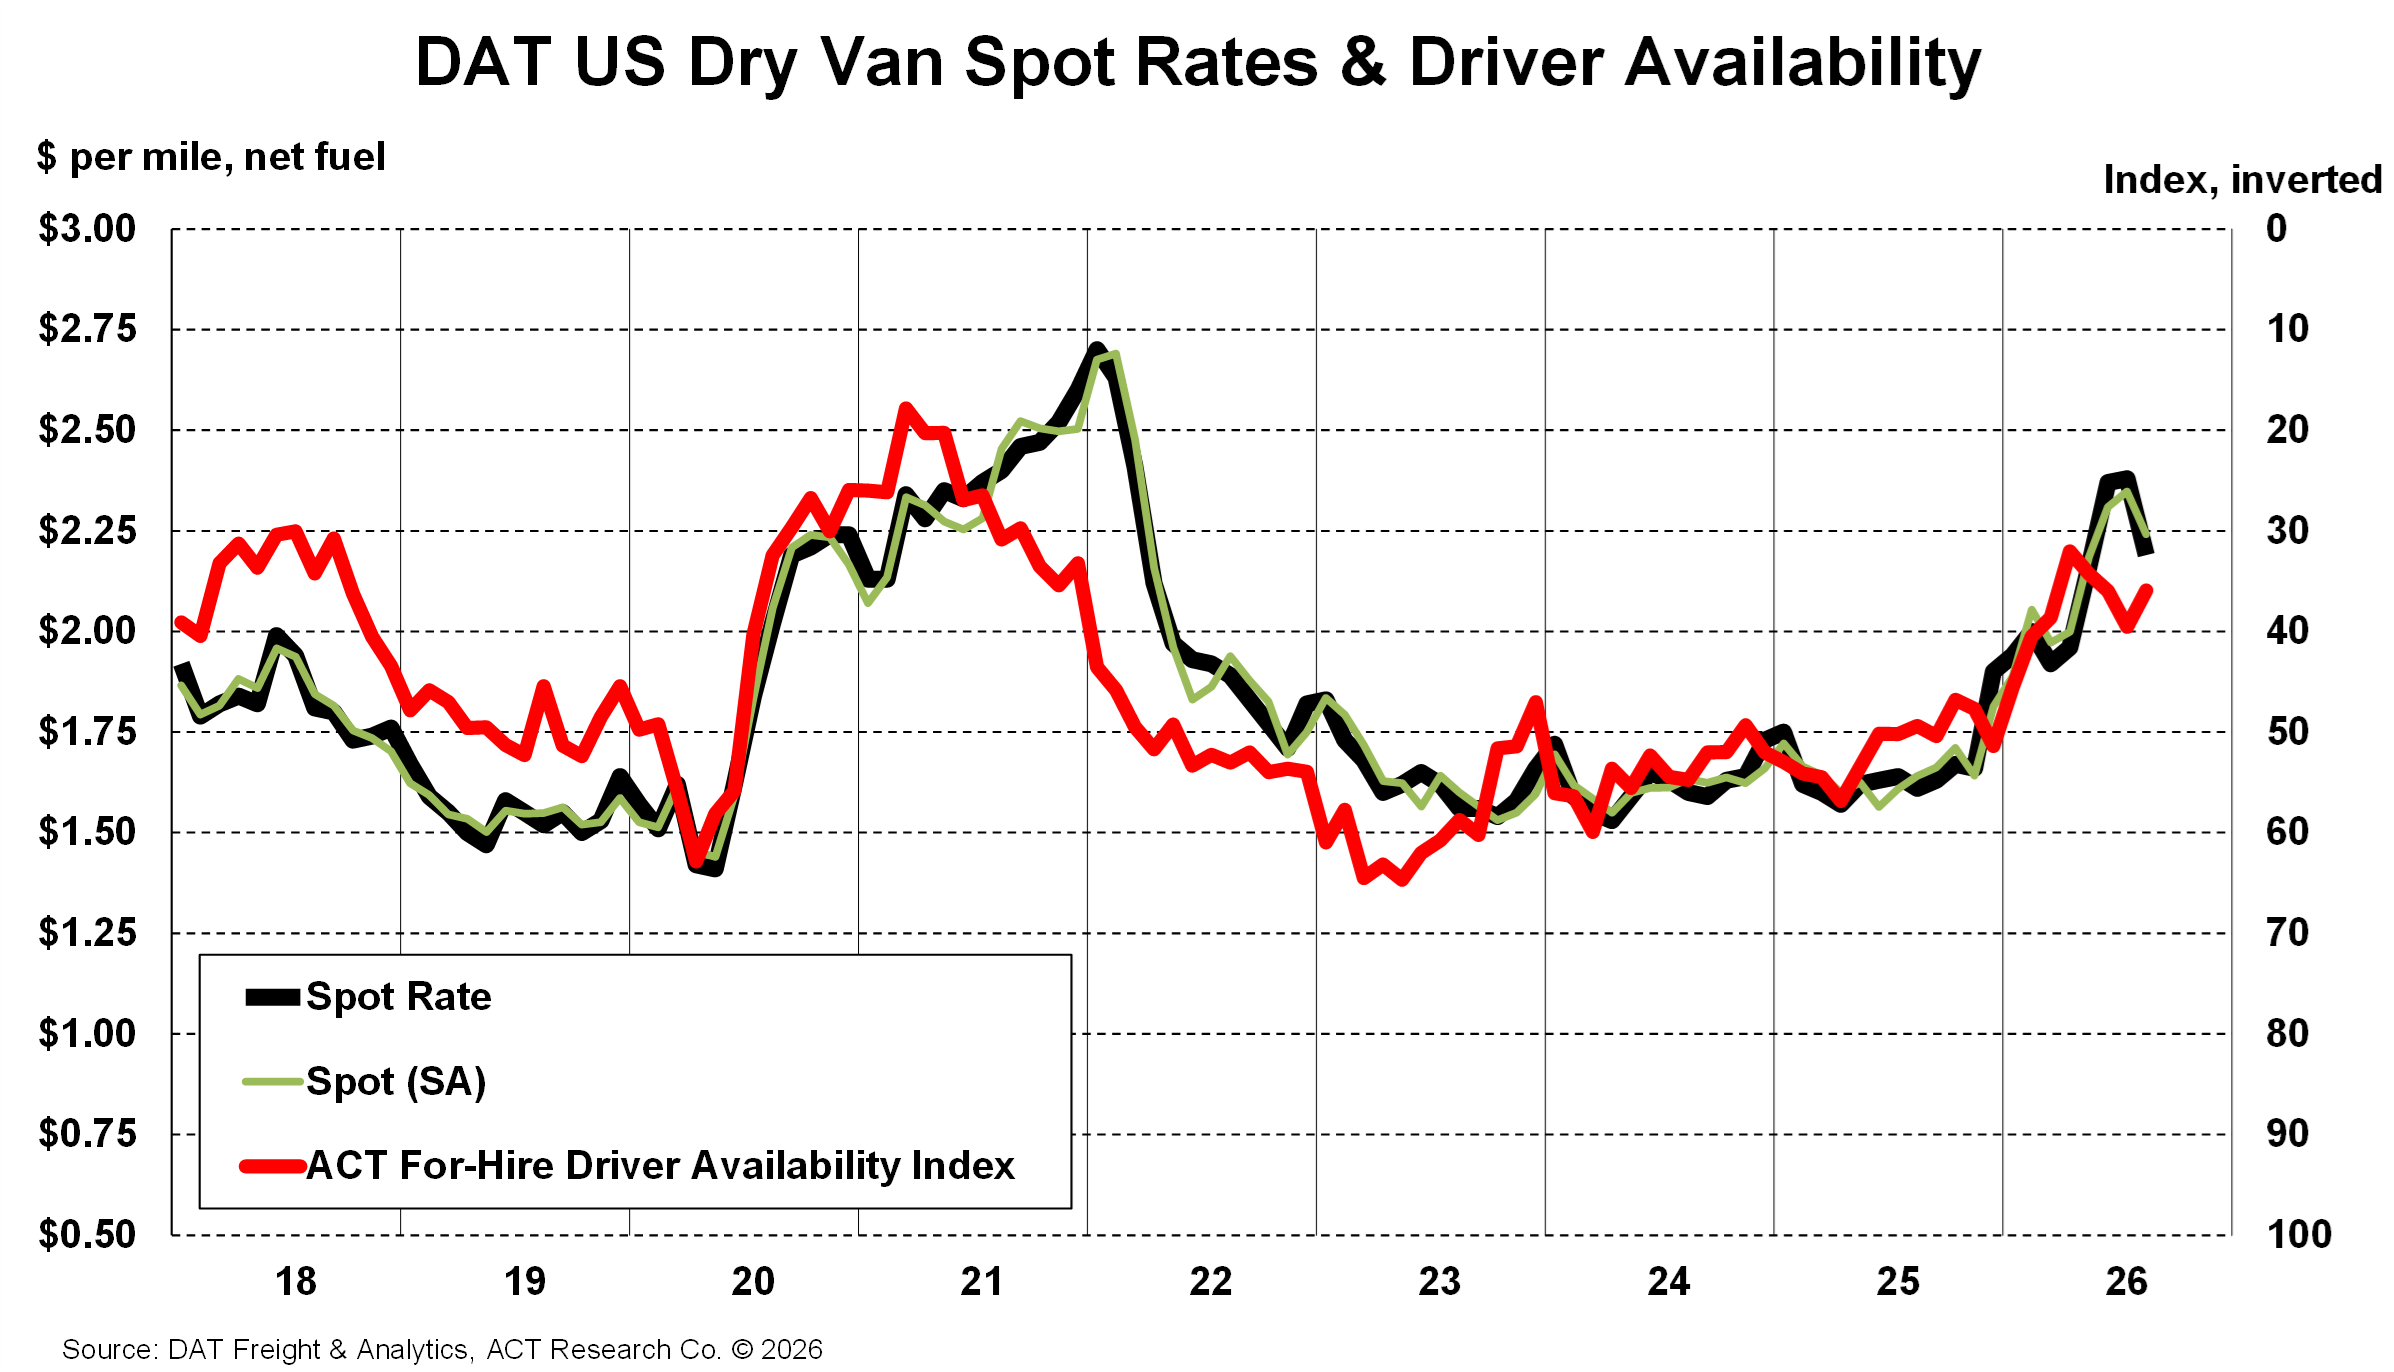
Dry van spot rates declined from July but remained well above year-earlier levels. Seasonal moderation contributed, while higher diesel costs also reduced the amount carriers retained after fuel. Spot conditions tightened again around late-August and early-September disruptions.
Contract Rates
Dry van contract rates were unchanged from July and higher than a year earlier. Spot and contract pricing therefore continue to reflect different adjustment timing and fuel treatment.
Market Meaning
The softer spot result does not establish that capacity has normalized. ACT’s September Freight Forecast describes tight driver availability and improving demand signals. For carriers, brokers, and shippers, the question is how those national signals compare with their own volumes, service performance, and lane exposure.
“As of September 2026, dry van rates remain well above year-ago levels, although spot pricing moderated in August. Dry van spot rates, excluding fuel, declined 18 cents to $2.20 per mile, still up 37% year over year. Seasonal easing and carriers’ incomplete recovery of higher diesel costs contributed to the decline, so softer net-fuel rates do not necessarily indicate a comparable easing in capacity. ACT’s September Freight Forecast points to a broader contribution from improving freight demand, while driver availability tightened again in August. Capacity constraints remain central to the pricing recovery, even as demand begins to provide additional support.
Dry van contract rates, excluding fuel, held steady at $2.40 per mile in August, up 20% year over year. Contract pricing continues to reflect the earlier strength in spot markets, with shorter agreements and more frequent rebidding accelerating the adjustment. Improving tractor sales and a return to tractor-fleet growth suggest that a capacity response is beginning, but replacement needs, exports, driver constraints, and higher equipment costs limit how quickly purchases translate into additional freight-hauling capacity. The durability of the recovery will depend on whether broader freight growth continues and how quickly carriers can add productive capacity while managing fuel, labor, insurance, financing, and equipment costs.”

Tim Denoyer
VP & Sr. Analyst

Resources
Whether you’re new to our company or are already a subscriber, we encourage you to take advantage of all our resources.