
The term freight refers to the bulk goods transported through the supply chain by truck, train, ship, or plane. Freight rates refer to the cost shippers pay carriers to haul their products within the truckload (TL) market.
Freight rates are calculated based on many factors not limited to economic demand, fleet capacity, fuel prices, weight, size, distance, and the type of goods being shipped. Rates are negotiated and agreed upon by the shipper and carrier either on a contract or on-the-spot basis. Throughout the year, but particularly during request-for-proposal (RFP) season in the contract market, shippers utilize reliable freight data and analysis from ACT Research, DAT, and others, in order to strategically compose RFP bids.
It’s important for businesses to understand where freight rates are in order to adjust to the always fluctuating truckload market and plan accordingly.
What factors influence freight rates?
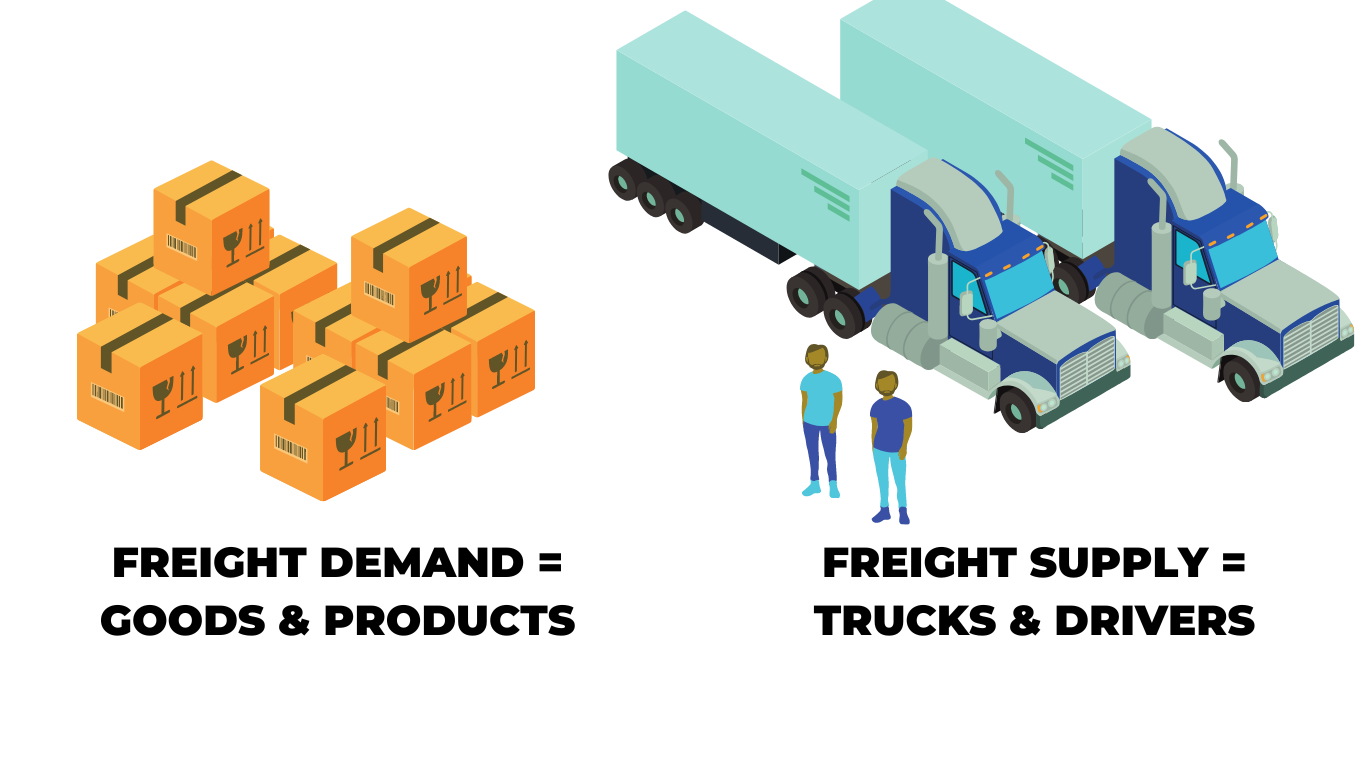
Beyond the truckload cycle (keep reading to learn more about how the TL cycle impacts freight rates), there are many factors that influence freight rates. But what are the major considerations? ACT’s freight analyst, Tim Denoyer, says “Simply put, supply and demand.”
Supply and demand in the TL market dictates where freight rates currently fall. When demand grows faster than capacity and the supply of drivers or tractors is short, prices rise. When supply growth outpaces demand growth, prices fall. This is cyclical.
But to break it down further, consider how economic demand and fleet capacity impact freight rates.
Economic demand
Almost every physical product made or sold in the economy is transported by full truckload freight. The two largest economic markets for the TL industry are the retail and industrial sectors. We like the old axiom: If you bought it, a truck brought it.
At the risk of generalizing: When the economy is booming, people spend more money on things, creating more freight needing to be hauled. On the flipside, when the economy is in a downturn, people spend less money on things, reducing the amount of freight needing to be hauled.
As a general rule, freight generation per capita is fairly stable over the long term. Slower population growth clearly has longer-term ramifications on freight generation and economic activity broadly.
Freight tends to grow fastest early in the economic cycle when businesses are both growing and adding inventory, and then tends to slow later in the cycle. Freight rarely grows for much more than two years before hitting soft spots, or freight recessions, which happen more frequently than broader economic recessions. The freight cycle tends to last about two years on the upside, and downturns tend to last anywhere from a few months to two years.
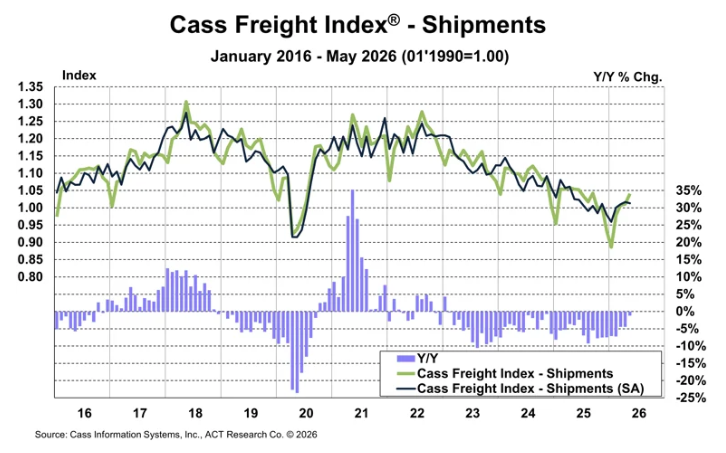
Updated Cass Freight Index® – June 2026 (May data)
Updated June 29, 2026
Freight rates entered June 2026 with stronger upward momentum as truckload capacity tightened further and contract pricing responded more clearly to earlier spot-market gains. ACT’s June Freight Forecast shows the truckload market has entered a period of rising rates and tight capacity, with driver availability falling sharply. Roadcheck confirmed the tighter market balance, and rates remained firm even as load-to-truck ratios moderated in early June.
The Cass Freight Index® – Shipments component remains an important demand-side check on the rate story. Freight activity is improving in pockets, supported by restocking, lower tariffs, a broadening industrial rebound, and private fleet contraction, but the market is still not being driven by a broad shipment surge. That reinforces the main market signal: freight rates are rising primarily because available capacity is tightening, not because freight demand has entered a broad-based expansion.
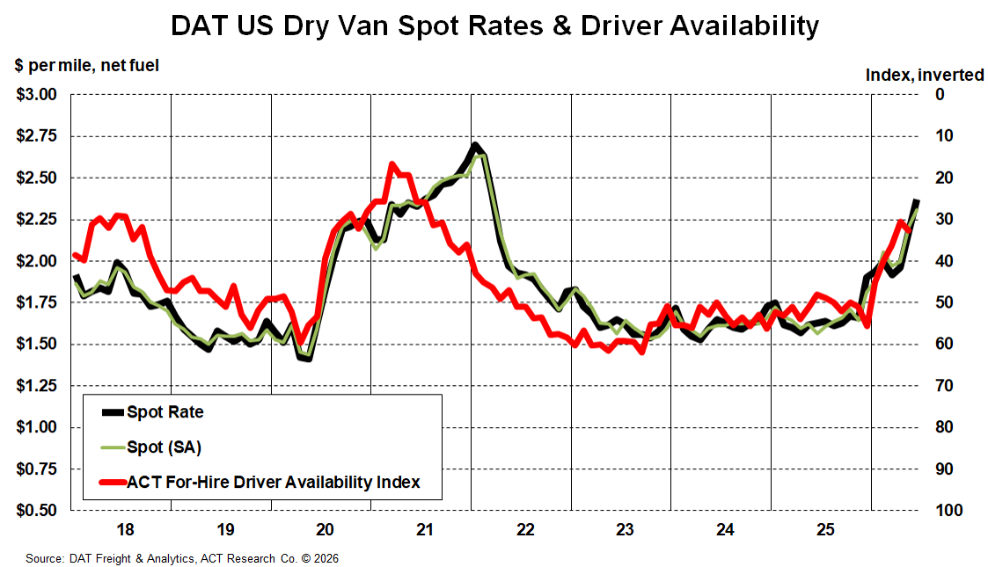
Spot freight rates remain the clearest signal of the shift in market balance. Dry van spot rates, net fuel, rose sharply year-over-year in May and were expected to remain significantly higher year-over-year in June, supported by falling driver availability, Roadcheck-related tightening, and continued supply-side pressure.
Contract freight rates are now following the spot market more clearly. ACT’s June Freight Forecast shows dry van contract rates, net fuel, rose month-over-month in May and were up year-over-year, with higher spot rates pressing contract rates higher and the historic spot-to-contract lag appearing to shorten. From a procurement perspective, shippers should monitor bid timing, carrier acceptance, and how quickly spot-market pressure flows into contract renewals.
Rate movement remains different by equipment type. Dry van rates have accelerated, reefer conditions remain sensitive to produce and temperature-controlled freight cycles, and flatbed has become one of the strongest areas of the market, supported by construction, energy, infrastructure, utility, and project-related freight.
Capacity remains the most important driver behind current freight rate trends. Driver availability has tightened sharply, while nondomiciled CDL rules, FMCSA enforcement, fraudulent ELD removals, driver school closures, and related policy effects are limiting available supply. These constraints are helping support higher rate floors even though freight demand remains uneven.
Overall, freight rates are improving because the market is tightening from the supply side. The Cass Freight Index® – Shipments component shows freight activity has stabilized but is not yet broadly expansionary, while spot rates are leading, contract rates are following, and capacity is becoming more constrained. Shippers, carriers, brokers, fleets, and logistics teams should monitor Cass Shipments, spot-contract spreads, load-to-truck ratios, carrier availability, equipment-type differences, driver availability, and whether current rate momentum continues through upcoming procurement cycles.
Fleet capacity
As capacity develops, consumer spending patterns shift and inventory is restocked. Freight demand is then reduced.
The concept of truck capacity is fluid. Normally, Class 8 tractors over eleven years old are generally not hauling freight in the TL or less-than-truckload (LTL) space, but that’s not uniform across fleets.
When conditions tighten enough, older trucks are brought back on the highways because the OEMs and parts suppliers can’t immediately respond to spikes in demand. And when capacity becomes loose, older and less efficient trucks are pushed out by lower freight rates.
How do rates differ between each type of freight trucking?
In a freight recession (bottom phase), like we’re in right now, we’re seeing freight rates declining across the board. The rate spread between the two specialized trailer types, flatbed and reefer, relative to dry van, widens in the cycle bottom. That spread tightens a bit in the early-cycle phase as dry van rates catch up a bit. But the spread stays wide into mid-cycle and then contracts in the late cycle.
But, generally speaking, is there nuance between each type of freight trucking?
Dry van trucking
A dry van truck hauls dry cargo in a totally enclosed trailer. Dry van is the largest and most standardized type of truckload shipping and is dominated by retail goods.
Refrigerated trucking
A refrigerated truck hauls temperature-sensitive products, such as food, film, and medications, in a refrigerated (reefer) van trailer. Rates in the reefer market tend to be steadier compared to other types.
Flatbed trucking
A flatbed truck hauls products in a platform trailer chassis with a flat loading deck without permanent sides or roof. Flatbed tends to haul more industrial freight, like machinery and construction materials. Theoretically, flatbed freight rates fluctuate more due to the flatbed market being seasonal.
The rates of all types of trucking are linked. Although the freight and trailer type can vary a lot, most tractors can move any of the three main trailer types.
How do freight rates differ between contract and spot trucking?
Contract freight rates are a fixed price agreed upon by the carrier and shipper and set for a designated period of time. Spot rates are on-the-spot prices, as the name implies, for shippers without carrier contracts. It’s easy to assume that spot rates are more volatile than contract rates, and while that may be true, there are pros and cons to both, depending on how you’re looking at it. Businesses participate in both the contract and spot markets to cover unexpected shipment changes and to diversify their short- and long-term strategy.
What are current freight rates?
As of April 2024, dry van spot rates are $1.53 per mile; DAT reefer spot rates are $1.83 per mile; and flatbed spot rates are $1.98 per mile. For further breakdown and analysis of current freight rates, check out ACT’s Freight Trucking Rates data tracker, updated monthly.
Freight rates have the power to make or break balance sheets, but what goes up must come down, and the rise and fall of freight rates is cyclical.
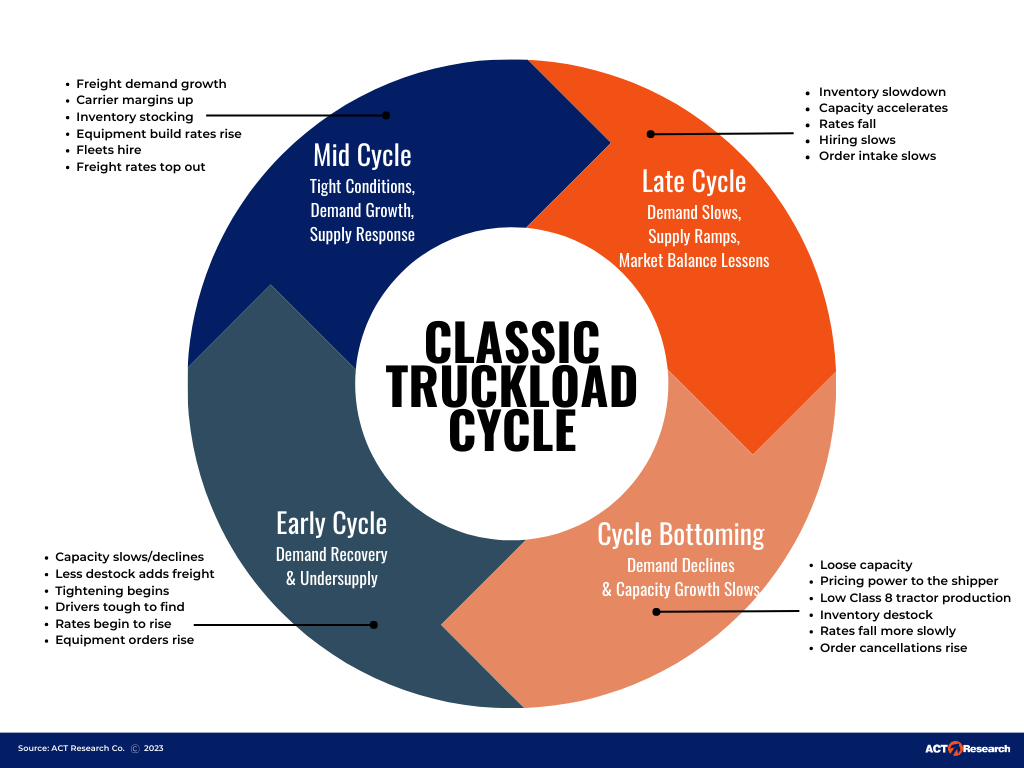
In the classic truckload cycle, there are four general phases, and freight rates are impacted based on which phase we’re in.
- Early phase: Rates rise
- Mid-phase: Rates plateau
- Late phase: Rates fall
- Bottom phase: Rates continue to fall, but more slowly
Rinse and repeat.
To see how freight rates are likely to change in the future, and for detailed analysis and forecasts for truckload, less-than-truckload, and intermodal, see ACT’s freight & transportation forecast.