
The Truckload Cycle
ACT Research provides expert analysis of the truckload market cycle, explaining how shifts in freight demand and carrier capacity drive pricing volatility and industry profitability.
The truckload market moves through repeating cycles of tightening and loosening capacity. Freight demand, carrier profitability, truck supply, driver availability, equipment purchases, and pricing power all shift as the cycle progresses. ACT Research helps customers understand where the truckload market may be in the cycle, what signals matter, and how those signals can affect freight rates, capacity, equipment demand, and planning decisions.
Early Cycle: Demand Recovery & Tightening Capacity
The truckload cycle often begins to turn when freight demand improves while available capacity remains limited or slow to respond.
As load volumes rise and equipment or driver supply tightens, utilization improves and pricing power begins to shift toward carriers. Spot rates often move first, followed later by contract rates as bid cycles reset.
During this stage, ACT typically watches for:
- Rising freight demand
- Improving spot rates
- Tightening load-to-truck ratios
- Low or recovering Class 8 tractor production
- Accelerating Class 8 orders
- Improving carrier profitability
- Early signs of driver-market tightening
Mid-Cycle: Demand Growth and Capacity Response
As rates rise and carrier profitability improves, fleets begin adding capacity. They may raise driver pay, seat more trucks, order new tractors and trailers, and expand operations to capture stronger market conditions.
Because the truckload market is fragmented, many carriers often make similar decisions at the same time. That collective response can eventually add more capacity than the market needs.
During this stage, ACT typically watches for:
- Strong spot and contract rates
- Improving carrier margins
- Rising Class 8 orders
- Higher tractor and trailer build rates
- Longer equipment backlogs
- Improved driver recruiting conditions
- Increased fleet investment
Late Cycle: Slowing Demand, Rising Supply, and Rate Pressure
Late in the cycle, freight demand growth begins to slow while capacity added earlier continues to enter the market.
Shippers may shift freight to private fleets, improve network productivity, rebid contracts, or use softer market conditions to reduce transportation costs. At the same time, new equipment ordered during stronger conditions may continue arriving.
When capacity growth outpaces freight demand, rates come under pressure. Carrier profitability weakens, equipment orders slow, cancellations may rise, and fleets become more cautious.
During this stage, ACT typically watches for:
- Slowing freight volume growth
- Falling spot rates
- Contract rate pressure
- Rising equipment availability
- Lower carrier profitability
- Slowing Class 8 orders
- Higher cancellations
- Softer used truck values
Cycle Bottom: Capacity Exits and Rates Stabilize
At the bottom of the cycle, weak rates and lower profitability pressure marginal capacity. Fleets reduce equipment budgets, delay replacement, cancel or defer orders, and focus on preserving cash.
Some carriers exit the market, reduce fleet size, or shift operations. As capacity leaves and equipment acquisition slows, supply and demand can begin to rebalance.
Driver shortage headlines may fade during this stage because freight demand is weaker, but underlying driver retention and quality-of-life challenges remain.
During this stage, ACT typically watches for:
- Low spot rates
- Weak carrier profitability
- Capacity exits
- Slower Class 8 orders and builds
- Lower used truck values
- Reduced replacement activity
- Improving supply-demand balance
- Early signs of freight demand recovery

Who participates in the truckload cycle?
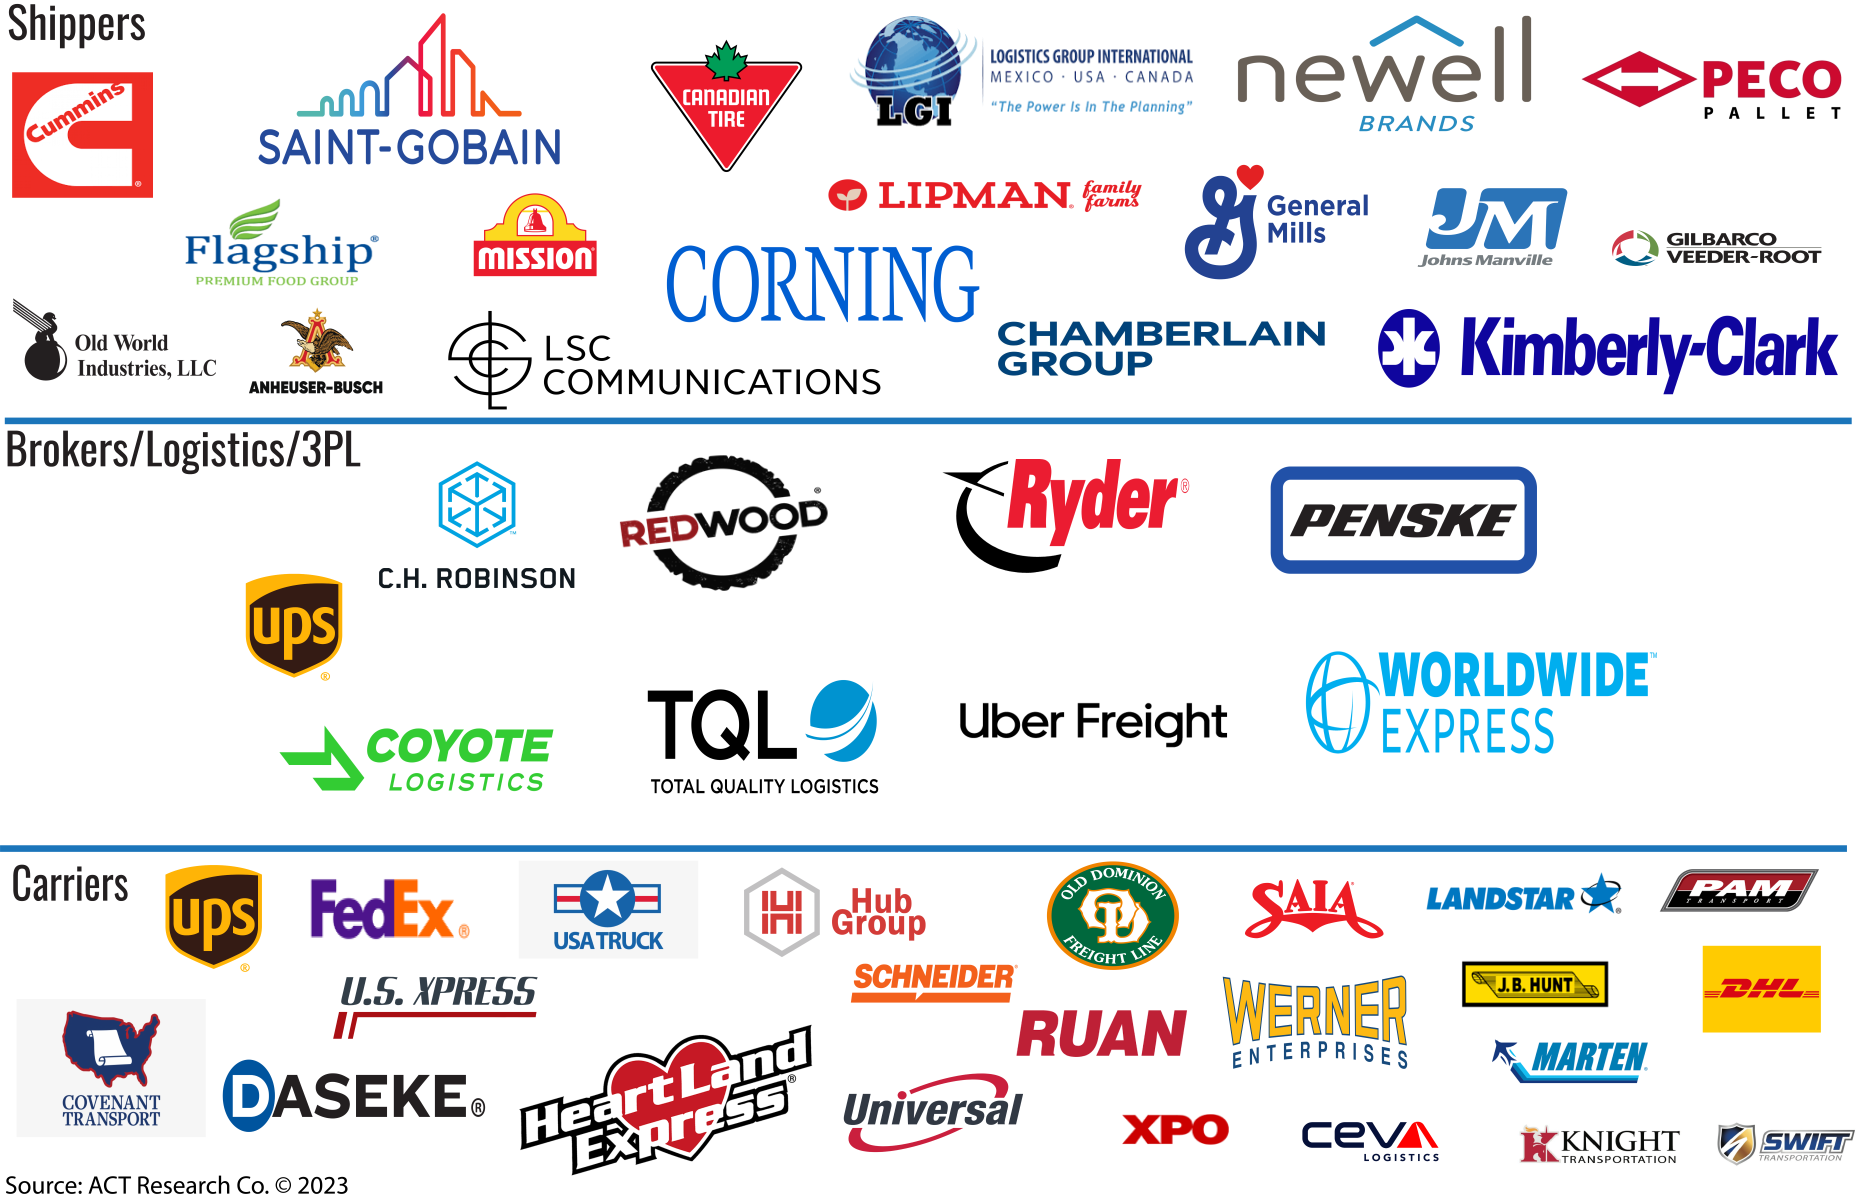
The truckload cycle is shaped by the decisions of shippers, brokers, logistics providers, private fleets, for-hire carriers, equipment providers, and the customers who ultimately create freight demand.
Shippers
Shippers are companies that own or manage goods that need to move from one location to another. They may use for-hire carriers, brokers, logistics providers, private fleets, or a combination of transportation options.
Shipper behavior affects freight demand, procurement timing, routing, bid cycles, private fleet activity, and rate pressure.
ACT uses freight market indicators, including data from Cass Information Systems, to help evaluate shipment activity, freight expenditures, and truckload pricing trends.
Brokers/Logistics/3PL
Brokers, logistics companies, and 3PLs connect shipper demand with carrier capacity.
Brokers often match freight with available carriers. Logistics providers help plan and coordinate transportation networks. 3PLs may provide transportation, warehousing, fulfillment, and other supply chain services.
These companies are often closest to changes in spot market activity, customer demand, routing shifts, and capacity availability.
Carriers
Carriers provide the truck, driver, trailer, and operating capability needed to move freight. They may operate in for-hire truckload, private fleet, dedicated, regional, specialized, or other transportation segments.
Carrier profitability, utilization, driver availability, and equipment strategy are central to the truckload cycle.
Major freight modes and how they relate to the truckload cycle
Truckload is one of the largest freight markets in the U.S., but it does not operate in isolation. LTL, intermodal, drayage, last mile, private fleets, and parcel networks all interact with truckload capacity and pricing.
When rates or service conditions change in one mode, freight can shift between modes or networks depending on cost, service, reliability, and shipper requirements.
If ACT wants to keep the 2022 revenue detail, frame it as historical context:
Truckload
Truckload freight typically involves shipments large enough to use most or all of a trailer. Truckload is closely tied to retail, consumer goods, industrial production, imports, exports, and inventory activity.
The truckload market includes both for-hire carriers and private fleets. For-hire carriers transport freight for shippers. Private fleets are operated by companies whose core business is not trucking, but who manage their own transportation operations to control service, cost, reliability, or network flexibility.
TL Fleet Types
The TL sector splits between for-hire carriers and private fleets. For-hire represents 31% of US freight market revenue, or $387 billion. Private fleets, which we estimate are larger at 32%, is worth $394 billion. Combined, TL represented about $781 billion of the $1.24 trillion US freight market revenue in 2022.
For-Hire
For-hire carriers transport freight for shippers under contract, spot market arrangements, dedicated agreements, or other service models.
For-hire truckload markets are highly sensitive to freight demand, capacity, spot rates, contract rates, carrier profitability, driver availability, and equipment costs.
Private
Private fleets are transportation operations owned or operated by companies whose primary business is something other than trucking.
Private fleets can give shippers greater control over service, dedicated routes, customer experience, and transportation reliability. During certain market conditions, private fleet growth can also affect for-hire truckload demand and capacity balance.
LTL
Less-than-truckload freight involves shipments that are larger than parcel but smaller than full truckload. LTL carriers consolidate multiple shipments through terminal networks.
LTL pricing, tonnage, shipment weight, and operating performance can provide useful signals about industrial activity, retail freight, business demand, and freight-market health.
Intermodal
Intermodal freight moves through more than one transportation mode, typically using rail and truck in combination.
Intermodal can compete with or complement truckload depending on lane, distance, service requirements, pricing, rail performance, equipment availability, and shipper priorities.
Drayage
Drayage is the short-distance movement of freight, often between ports, rail terminals, warehouses, and nearby destinations.
Drayage is closely tied to container flows, port activity, intermodal networks, imports, exports, and regional freight movement.
Last Mile
Last mile refers to the final movement of freight from a hub, store, warehouse, or distribution point to the end customer.
Last-mile activity is influenced by e-commerce, parcel demand, retail networks, urban delivery requirements, and consumer behavior.

The Economics of Freight
Understand how freight-generating economic activity connects to Class 8 tractor demand, equipment replacement, carrier profitability, and the broader transportation cycle.

Market Indicators
See how ACT tracks key freight, commercial vehicle, equipment, economic, and survey-based indicators to understand current market conditions and cycle movement.

Explore related truckload and freight market resources
Explore related ACT resources to understand freight demand, truckload rates, capacity, market indicators, and the broader transportation cycle.
Need deeper truckload market intelligence?
ACT can help you identify the freight forecast, truckload rate data, survey index, report, or analyst perspective that fits your planning needs — whether you are evaluating rates, capacity, freight demand, carrier profitability, equipment demand, or market-cycle risk.