Freight Trucking Rates
Truck Freight Rates: August 2026 Van, Reefer & Flatbed Update
ACT Research provides consolidated, forward-looking freight rate analysis — helping carriers, brokers, and shippers plan contract strategy with confidence.
Freight & Trucking Rate
August 2026 Update
August 28, 2026
As of August 2026, the truckload rate environment remains tight, although the market has entered a seasonal pause following the sharp increase in rates during the first half of the year. Pricing strength continued across dry van, flatbed, and reefer equipment in July and moved more fully into contract markets. Aggregate spot rates remained above contract rates, signaling acute tightness even as spot conditions began to ease in early August.
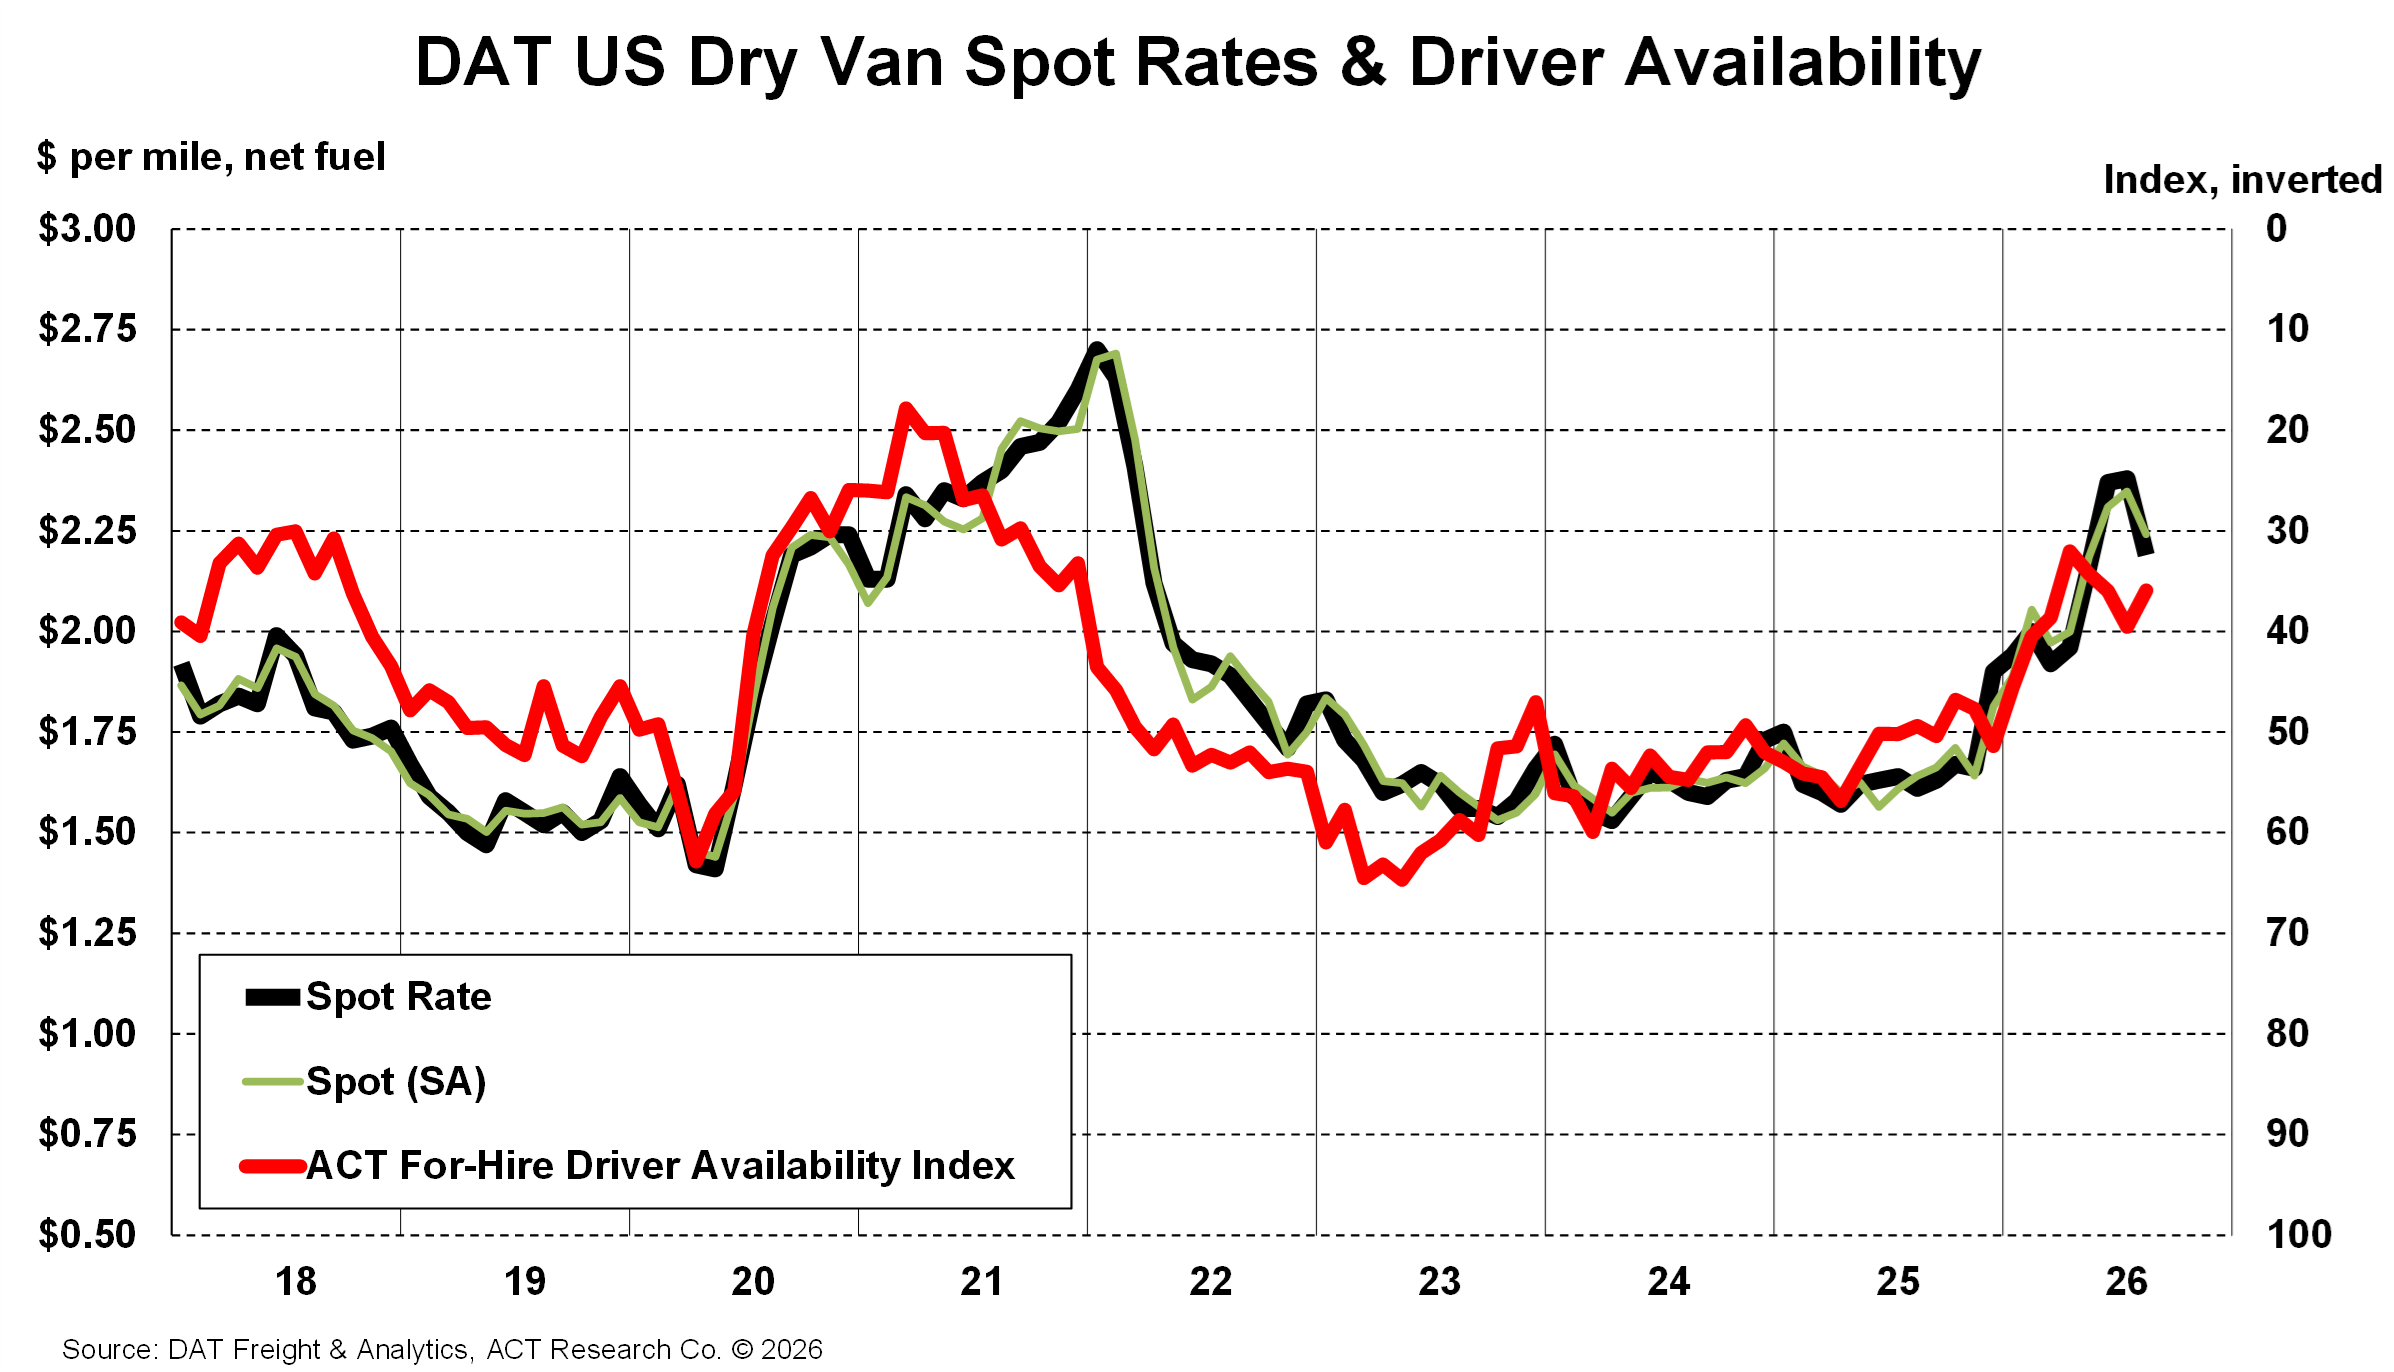
The primary driver remains supply. Regulatory enforcement, reduced driver availability, several years of for-hire capacity contraction, and limited equipment investment continue to constrain the market. Driver availability has shown signs of stabilizing as higher pay attracts drivers and freight demand softens seasonally, but ACT’s August Freight Forecast continues to characterize the cycle as early-stage and supply-driven. Broader freight demand remains soft, particularly in housing, consumer goods, and the larger truckload contract market.
Below are the latest dry van, flatbed, and reefer rate insights from ACT Research’s August 2026 Freight Forecast.

Dry Van
Dry van spot rates continued to accelerate in July, rising 47% year over year to $2.41 per mile, excluding fuel. In seasonally adjusted terms, rates increased seven cents from June and were 74 cents higher than at the end of 2025.
Capacity remained exceptionally tight around the July 4 holiday. Equipment postings fell to their lowest level in a decade even as spot-market demand remained well above year-ago levels. Conditions began to ease in late July and early August as freight entered the seasonally softer third quarter and driver availability improved modestly.
Dry van contract rates also strengthened, rising 18% year over year to $2.38 per mile, excluding fuel. Contracts are responding more quickly than during prior freight cycles as shorter agreements and more frequent mini-bids compress the traditional lag between spot and contract pricing.
For shippers, that shortened lag means spot-market changes can move into transportation budgets and bid activity sooner. Carriers are regaining pricing leverage, but the durability of that leverage will depend on the balance between regulatory constraints, driver availability, equipment production, and still-soft freight demand.
Flatbed
Flatbed remained one of the strongest truckload segments in July. Spot rates reached $2.92 per mile, excluding fuel—the second-highest monthly level on record—and were 41% higher year over year. Rates eased three cents from June as peak construction seasonality began to pass.
Data-center construction, related power-generation projects, and energy-sector activity have contributed to unusually strong demand for specialized capacity. Housing and cross-border freight remain comparatively soft, however, and lower oil prices have started to remove some of the additional pressure generated by energy activity.
Flatbed contract rates increased to a record $3.09 per mile, excluding fuel, rising 20% year over year. This continued contract-rate strength shows that the segment’s improvement extends beyond short-term spot-market volatility.
Some further seasonal moderation is possible, but specialized equipment requirements, regulatory enforcement, and strong demand for dedicated capacity continue to support pricing. Fleets, shippers, and suppliers should monitor whether data-center and energy-related activity remains strong enough to offset softer housing and industrial demand.
Reefer
Reefer pricing strengthened further in July. Spot rates rose eight cents from June to $2.77 per mile, excluding fuel, and were 41% higher year over year. On a seasonally adjusted basis, the monthly increase was 14 cents.
Reefer spot rates have now remained above contract rates for three consecutive months, the first such period since February 2022. That relationship reflects the tight availability of specialized capacity and the market’s sensitivity to seasonal freight and temperature-related demand.
Reefer contract rates increased seven cents in July to $2.63 per mile, excluding fuel, and were 13% higher year over year. The reefer trailer fleet remains historically old, adding another capacity consideration even as equipment durability has improved.
Spot rates began running below normal seasonal patterns in early August, consistent with the broader truckload lull. However, reefer pricing remains exposed to produce volumes, beverage demand, extreme temperatures, aging equipment, and the availability of qualified drivers. These factors can create renewed volatility around seasonal peaks even when overall consumer freight remains measured.
Contract Rates
Contract rates are responding more clearly—and more quickly—to the sustained strength in the spot market. Aggregate DAT contract rates, combining dry van, reefer, and flatbed, increased eight cents in July to $2.50 per mile, excluding fuel. That was six cents above the normal seasonal pattern and 17% higher than a year earlier.
In aggregate, spot rates were five cents above contract rates in July, or two cents on a seasonally adjusted basis. Spot rates trading above contract rates indicate an acutely tight truckload market. As spot conditions ease seasonally and contract rates continue catching up, ACT expects the spread to widen from these unusually tight levels during the third quarter.
The faster movement into contract pricing reflects the growing use of shorter agreements and more frequent mini-bids. Contract rates historically followed spot rates by five to six months, but that lag has shortened considerably during the current cycle.
For shippers, transportation budgets and bid strategies should account for contract pricing that responds faster to changing capacity conditions. For carriers, stronger contract rates improve revenue quality, but insurance, labor, equipment, financing, fuel, and regulatory costs remain important constraints on profitability.
Summary
Entering August 2026, truckload rates remain firmly above year-ago levels, but the market is transitioning from the rapid tightening of the first half into a seasonal lull. Dry van capacity remains constrained, flatbed continues to benefit from specialized industrial and infrastructure demand, and reefer retains meaningful seasonal and equipment-related risk.
The easing seen in early August should not automatically be interpreted as a reversal of the rate cycle. Driver availability has improved, freight demand remains soft, and equipment production is beginning to respond—all of which should slow the rate trajectory. At the same time, regulatory enforcement, higher equipment costs, reduced fleet capacity, and an aging equipment base continue to limit how quickly supply can normalize.
The market is therefore best characterized as early-cycle and supply-driven rather than demand-led. Shippers, carriers, brokers, fleets, and investors should continue monitoring spot-contract spreads, driver availability, regulatory enforcement, equipment production, seasonal demand, and whether improving carrier profitability produces a sustained capacity response.
To see how freight trucking rates change in the future, and for detailed analysis and forecasts, see ACT's freight & transportation forecast.
“Truckload pricing remained strong in July, with aggregate contract rates rising 17% year over year and aggregate spot rates remaining above contract rates—a signal of acute market tightness. Even so, the August Freight Forecast reinforces that the current cycle remains primarily supply-driven rather than the result of a broad freight-demand surge. Driver availability has shown signs of stabilizing, and the market has entered a seasonal lull, but for-hire capacity remains constrained and regulatory enforcement continues to limit supply. These conditions have shifted leverage toward carriers, although insurance, financing, equipment, labor, fuel, and other operating costs continue to absorb part of the benefit from higher rates.
Class 8 orders increased 71% year over year in July, led by a 103% increase in tractor orders. The sequential decline in orders reflected limited remaining 2026 build availability rather than a sudden deterioration in equipment demand, as backlogs remained well above historical levels. Improving carrier profitability, replacement needs, and EPA 2027 planning are supporting demand, but the equipment market still reflects disciplined capacity decisions more than broad-based fleet expansion. With new-equipment costs rising and the broader freight-demand outlook still uncertain, fleets remain focused on replacement timing, regulatory readiness, profitability, and cost control.”
Tim Denoyer
VP & Sr. Analyst
Freight's supply-driven upturn: How long will rates rise?

Resources
Whether you’re new to our company or are already a subscriber, we encourage you to take advantage of all our resources.