
Dry Van Rates
Dry Van Freight Rates: Spot & Contract Market Trends - October 2026
ACT Research provides data-driven insight into dry van spot and contract rate movements, helping industry leaders understand pricing trends and freight market conditions.
Dry Van Truckload (TL) Sector
October 2026 Update
October 26, 2026
Spot Rates
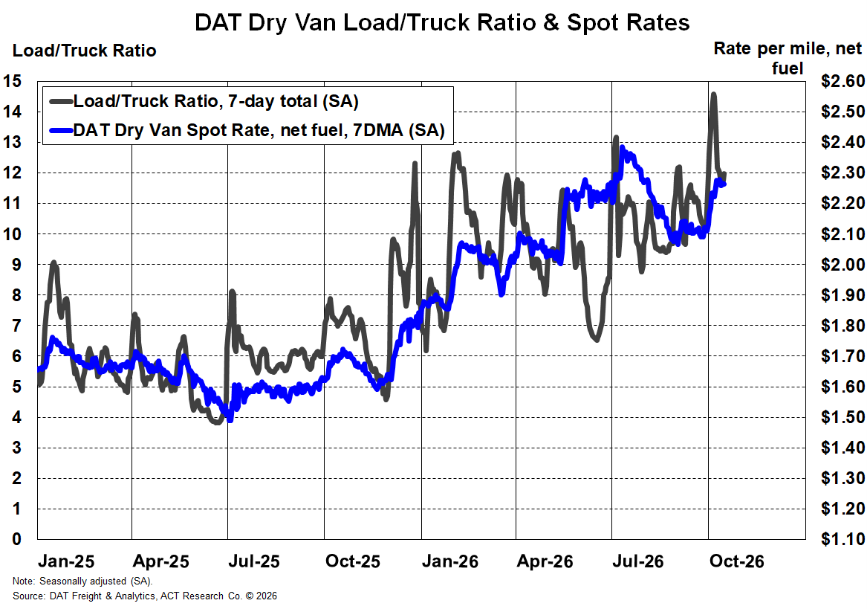
DAT U.S. dry van spot rates averaged $2.16 per mile excluding fuel in September. That was 3 cents below August but 33% above September 2025. The monthly decline and annual increase answer different questions. A shipper reviewing a fall bid should not read the monthly move as evidence that capacity is broadly abundant; a carrier should not treat the annual increase as an equal improvement in net margin.
Contract Rates
Dry van contract rates averaged $2.41 per mile excluding fuel, up 1 cent from August and 21% year over year. Contract rates reflect agreements that reset at different times, so they need not follow each short-term spot move. Bid dates, length of commitment, fuel provisions and service requirements can produce a different result from the national series.
Market Meaning
Higher diesel costs affected how much spot revenue remained after fuel in September. ACT's October Freight Forecast also describes constrained capacity and a more moderate aggregate demand outlook. Those forces can coexist: an individual carrier may face tighter operating capacity even when broad shipment growth is measured.
For shippers, compare lane-level awards, tender acceptance and all-in charges before resetting budgets. For carriers and brokers, test whether spot and contract revenue cover fuel, labor, equipment and service commitments. ACT's Freight Forecast places the current readings in the wider rate, volume and capacity cycle without relying on one month's national average.
“U.S. dry van spot rates averaged $2.16 per mile excluding fuel in September, down 3 cents from August but 33% above a year earlier. Contract rates averaged $2.41, up 21% year over year. The sequential spot decline and strong annual comparison are both real; neither tells the whole story about a shipper's all-in cost or a carrier's margin. Fuel treatment, contract timing and available capacity belong in the same planning conversation.”

Tim Denoyer
VP & Sr. Analyst

Resources
Whether you’re new to our company or are already a subscriber, we encourage you to take advantage of all our resources.