
2026 Class 8 Truck Market
September 2026
Updated September 28, 2026
Class 8 Sales Forecast 2026: Tractor Sales Improve as Production Ramps
The Class 8 truck market enters September 2026 with improving tractor sales, elevated backlogs, and a production response that requires careful interpretation. ACT’s latest State of the Industry report shows a more constructive market overall, but substantial differences between tractors and vocational trucks.
North American Class 8 retail sales increased 4.9% year over year in August. These results show why the total market should be evaluated alongside the applications and inventory conditions beneath it.
For the remaining months of 2026, the central question is how effectively customer demand converts into completed equipment, retail sales, and productive fleet use.
Orders Reflect Demand and Available Production Slots
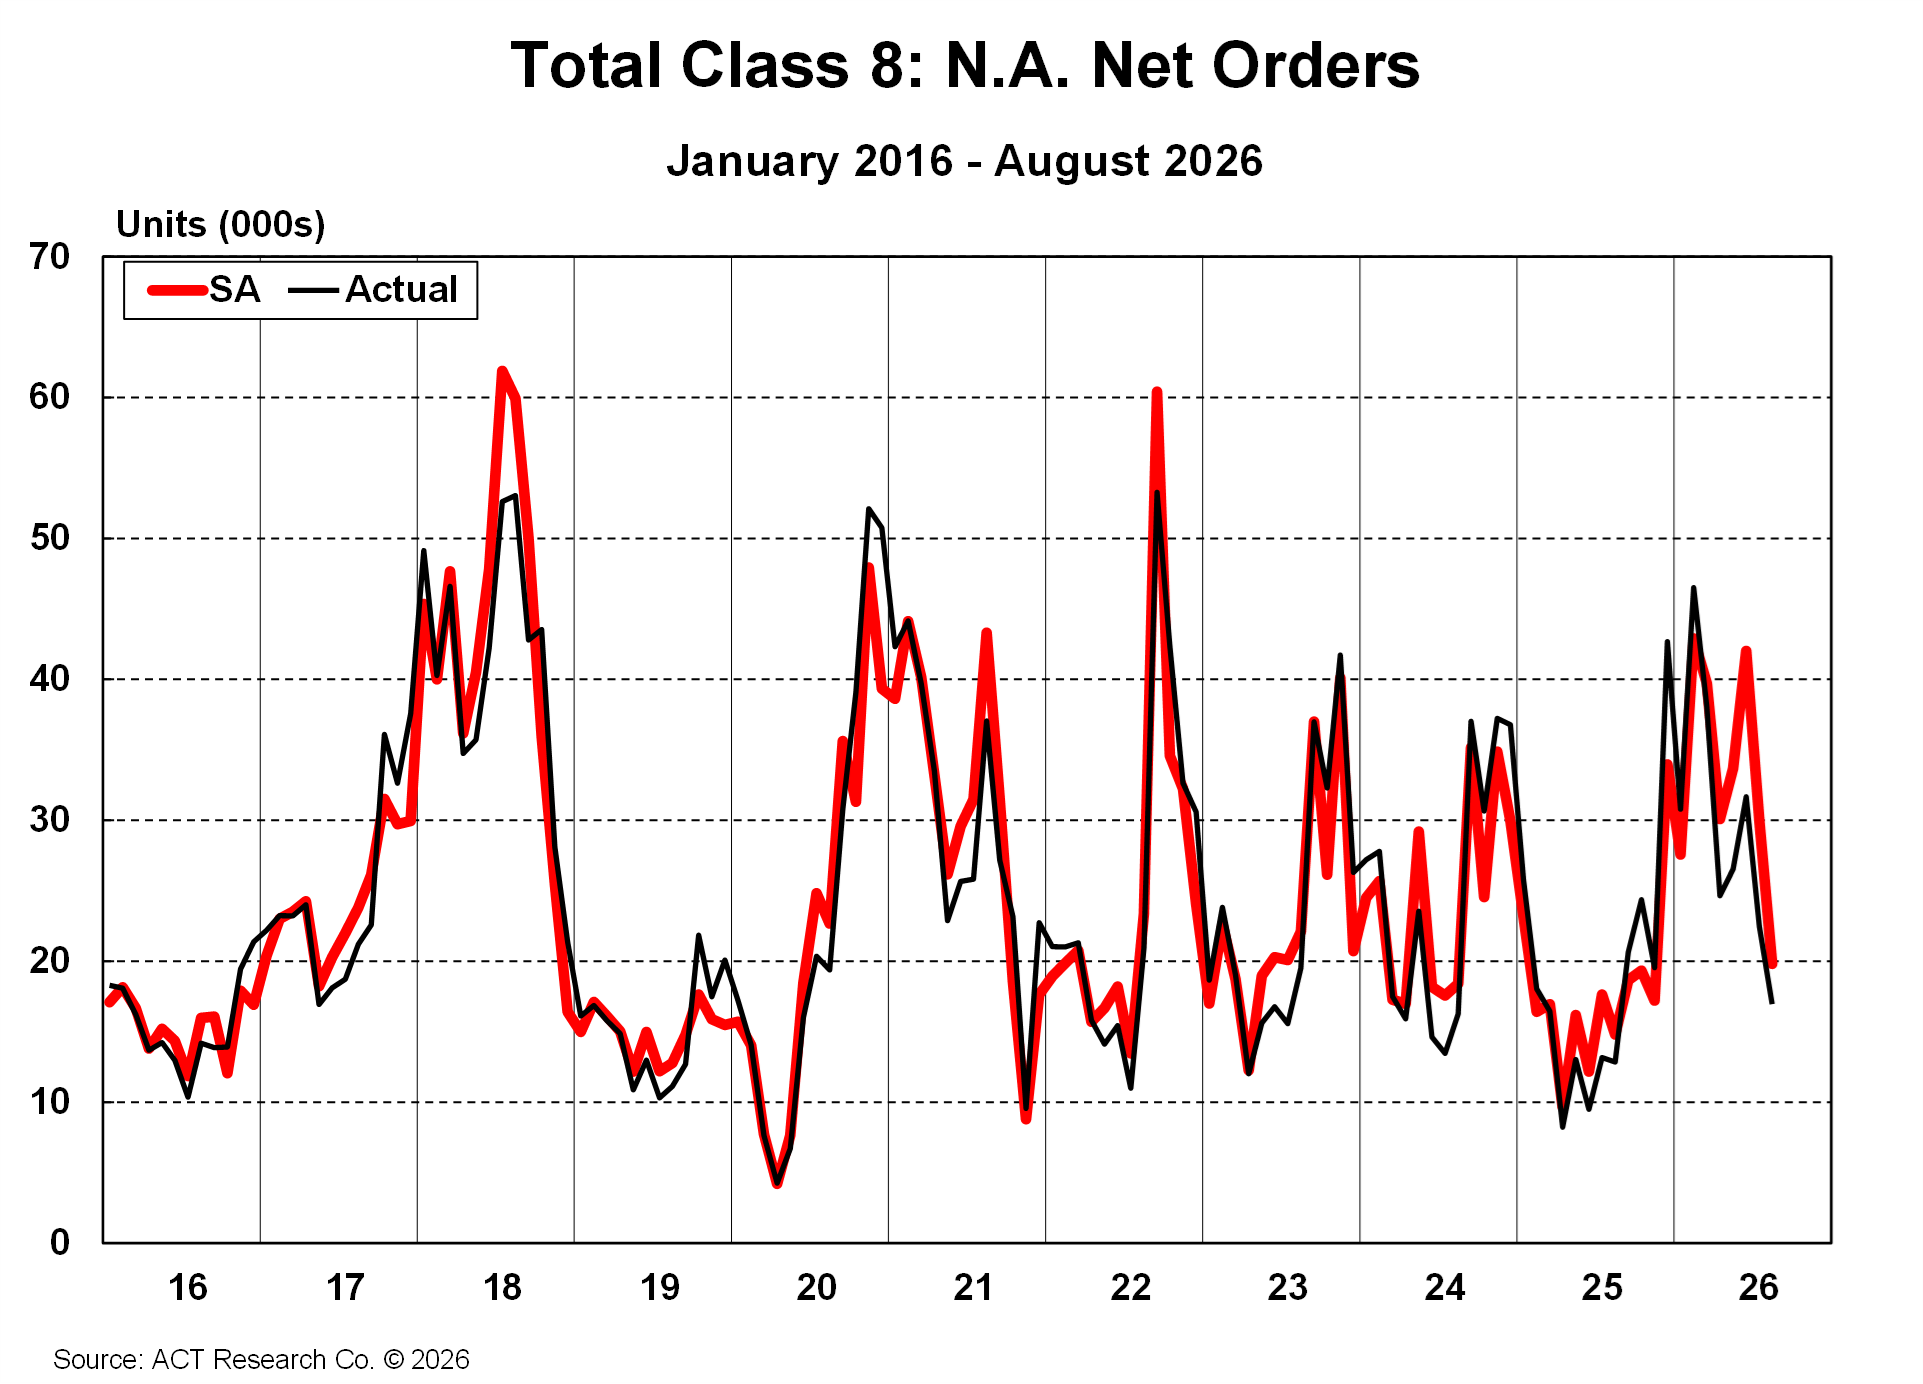
August Class 8 orders increased 32% year over year. The sequential result was softer on a seasonally adjusted basis, with full 2026 backlogs and the timing of 2027 orderboards limiting activity.
Monthly orders are therefore partly a measure of available ordering opportunity. Customers cannot book the same volume into a nearly committed production year as they can when manufacturers open new capacity for sale.
That does not make orders less useful. It means they should be assessed with backlog commitments, cancellations, and production schedules. Together, these indicators show how much demand is developing and when it could become equipment available to customers.
Production and Backlogs
Class 8 production increased in August, and OEM build plans moved higher. However, ACT cautions that the timing of unfinished units may have shifted reported output between July and August.
If equipment awaiting completion in one month is finished in the next, the resulting increase does not necessarily represent the same change in sustainable factory throughput. Several months of output, supplier performance, and completion activity provide a clearer view of the production trend.
Backlogs remained above historical norms despite declining during August. They continue to provide manufacturers with production visibility, while also highlighting the importance of meeting existing commitments.
For suppliers, the distinction between higher plans and completed output matters. For fleets and dealers, delivery reliability and the availability of the required configuration determine when investment plans can be executed.
Tractor and Vocational Markets Are Diverging
Improving freight economics and replacement requirements are supporting tractor purchases. Tractor inventories are healthier than vocational stocks, although they still need to be evaluated against current sales.
Vocational inventories remain elevated, and August retail sales were weaker. Selected end markets continue to receive support from project investment, but that support does not eliminate the need for inventory adjustment.
These conditions can produce different purchasing and production patterns within the same vehicle class. A manufacturer, supplier, or dealer focused on tractors may experience a different market from a business concentrated in vocational applications.
Inventory composition also matters. The availability of a particular specification can differ from the message implied by total stocks.
Replacement Purchases and Fleet Growth
Stronger tractor sales are beginning to support a return to fleet growth. However, a new purchase does not automatically add another truck to available freight capacity.
Some units replace older equipment, while retirements and exports affect the number remaining in domestic service. Driver availability and operating economics determine whether additional equipment can be used productively.
For fleets, the replacement decision includes maintenance, downtime, financing, acquisition cost, and confidence in future revenue. Higher freight rates improve that calculation, but fuel, insurance, and labor costs continue to influence the return.
For equipment providers, this supports a more constructive sales environment while reinforcing the value of understanding why customers are buying.
2026 Market Outlook
The remainder of 2026 will be shaped by production execution, replacement timing, retail demand, and inventory management. Backlogs support activity, but the market’s performance depends on delivering equipment that customers can finance, accept, and deploy.
Key measures to monitor include completed production, tractor and vocational retail sales, cancellation behavior, inventory turnover, and the opening of the next order cycle.
ACT’s State of the Industry reports track these developments as they occur. The Commercial Vehicle OUTLOOK connects them to the forward view, helping businesses evaluate production, sales, and equipment requirements across markets and configurations.

Want more data?
ACT’s commercial vehicle forecast delivers the most reliable, forward-looking insight into where Class 8 truck sales are headed—helping you anticipate shifts, plan with confidence, and stay ahead of the market.