
Trucking Industry 2026 Outlook
August 2026
Updated August 28, 2026
Trucking Industry Forecast 2026: Supply Tightening Reshapes the Market
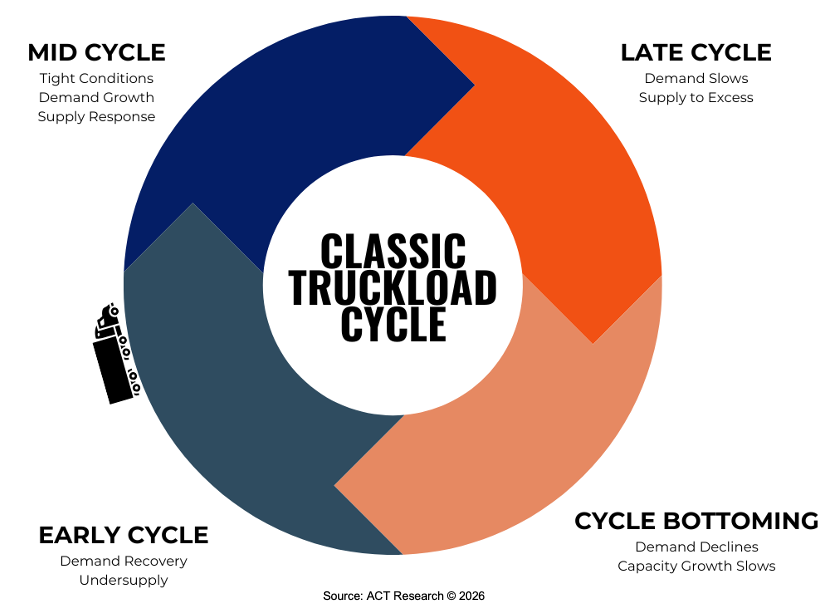
The trucking industry enters August 2026 with stronger evidence that constrained supply is changing the market balance. Freight demand remains uneven, but tight capacity, regulatory enforcement, reduced driver availability, and limited fleet growth are supporting substantially higher truckload rates.
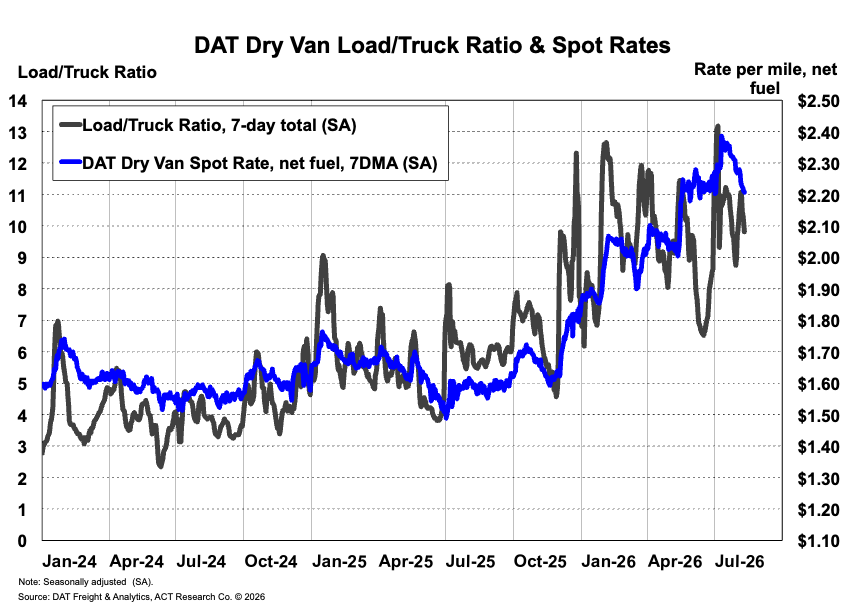
ACT’s August Freight Forecast shows dry van, reefer, and flatbed spot rates, excluding fuel, were 41% to 47% higher year over year in July, while aggregate contract rates increased 17%. Aggregate spot rates remained above contract rates, indicating that the market remained acutely tight even as spot conditions began to ease seasonally in early August.
The current Trucking Industry Forecast 2026 is still not defined by broad-based freight-demand acceleration. Instead, the market is being propelled primarily by capacity contraction and driver availability pressure. Regulatory and compliance developments are making it more difficult to add or retain marginal capacity, while elevated equipment, insurance, financing, labor, fuel, and maintenance costs continue to discourage aggressive fleet expansion.
Together, these conditions are creating a more constructive—but still disciplined—planning environment for fleets, carriers, dealers, leasing companies, suppliers, lenders, shippers, brokers, and investors.
Freight, Capacity, and Market Balance
Freight volumes remain mixed entering August, but the supply-demand balance has shifted meaningfully. Freight activity is improving selectively, and private fleet contraction is moving some freight back toward the for-hire market. However, the current rate upturn is still being driven more by capacity contraction than by a broad increase in shipment demand.
Aggregate truckload spot rates remained above contract rates in July. Contract rates, excluding fuel, increased eight cents during the month to $2.50 per mile and were 17% higher year over year. This spot-contract relationship points to acute market tightness, although contract rates are now catching up as shorter agreements and more frequent mini-bids compress the normal lag between spot and contract pricing.
Driver availability has shown signs of stabilizing as higher pay attracts drivers and freight demand softens seasonally. Even so, available equipment remains historically tight, the Class 8 tractor fleet has contracted, and compliance enforcement and driver qualification requirements continue to restrict the industry’s ability to respond quickly by adding trucks and drivers.
For shippers, carriers, and brokers, this means the freight market forecast for 2026 remains tied to supply discipline rather than a sharp demand rebound. Tighter capacity is supporting carrier pricing power, improving fleet economics, and producing additional contract-rate resets. At the same time, uneven freight demand and elevated operating costs could limit the pace and breadth of profitability improvement.
Rate moderation is underway during the third-quarter seasonal lull. However, market participants should not assume that softer seasonal demand will restore the excess capacity or purchasing leverage available during the prior downcycle. Regulatory constraints, higher equipment costs, and the time required for driver and equipment supply to respond continue to support the cycle.
Equipment Markets and Fleet Behavior
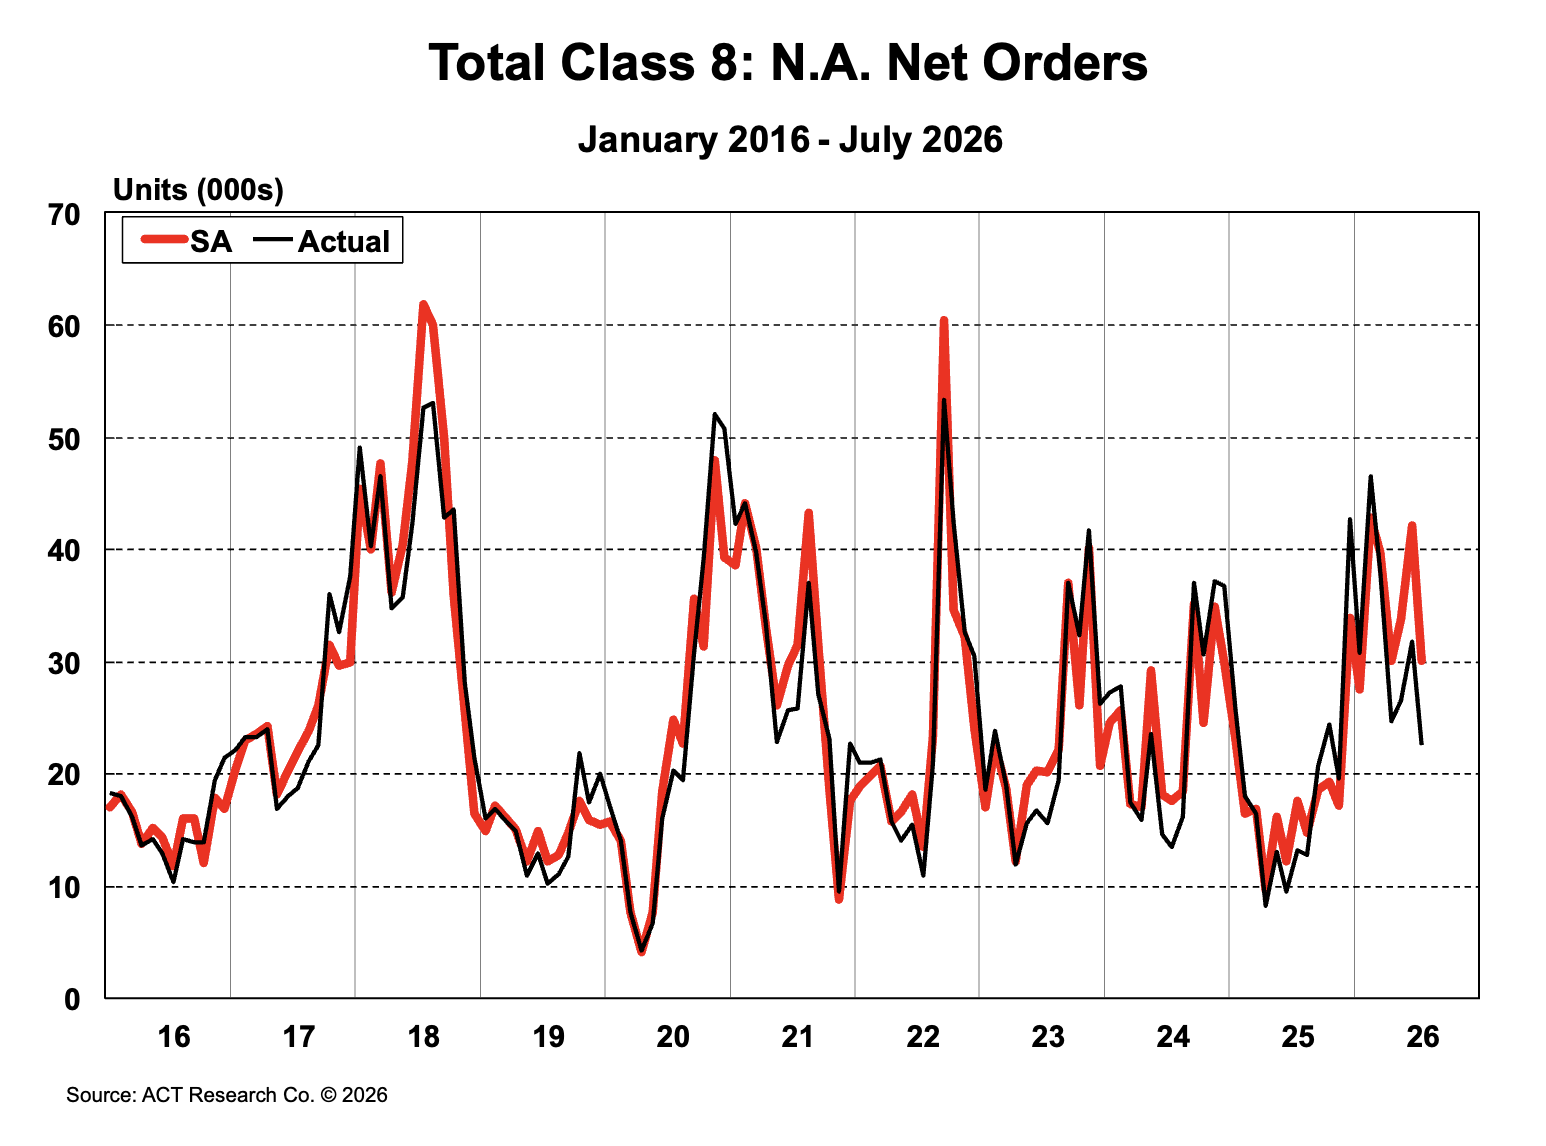
Class 8 demand remained strong in July as freight rates improved, carrier profitability strengthened, and EPA 2027 planning became more important to replacement decisions. North American Class 8 orders increased 71% year over year, with tractor orders rising 103%.
Orders declined 29% sequentially on a seasonally adjusted basis, but the decrease primarily reflected limited remaining 2026 build availability rather than a sudden weakening in demand. ACT estimates that demand for the remaining production slots exceeds available capacity.
Class 8 backlogs ended July at 182,817 units, equal to approximately 8.9 months of production on a seasonally adjusted basis and well above the historical average. Third- and fourth-quarter build plans moved modestly lower as manufacturers assessed how quickly supply could ramp. Retail sales increased 1.5% year over year, with tractor sales rising 8.2%. July marked the second consecutive month in which Class 8 sales exceeded estimated replacement demand.
The Class 8 truck forecast for 2026 remains constructive, but the improvement should not automatically be interpreted as broad fleet expansion. Purchasing decisions remain closely tied to replacement needs, equipment availability, financing conditions, regulatory timing, and confidence that higher freight rates will translate into durable cash-flow improvement.
For fleets, manufacturers, dealers, suppliers, and equipment finance teams, the key questions are how quickly production can respond, whether orders convert into completed deliveries, whether freight-market profitability continues to improve, and how fleets balance replacement requirements against higher equipment and financing costs.
Used-truck performance remains mixed. July same-dealer Class 8 retail sales declined 2.5% sequentially but increased 45% year over year. Average retail prices fell 4% during the month to $60,986 and were 2% below year-ago levels. Strong transaction activity, softer pricing, changing equipment age and mileage, and elevated exports make used equipment an important indicator of replacement confidence and domestic fleet capacity.
Medium Duty Classes 5–7
Medium-duty activity strengthened in July. Classes 5–7 orders increased 43% year over year, potentially reflecting continued economic resilience, dealer inventory positioning ahead of EPA 2027, and improving demand in selected applications.
ACT raised its 2026 Classes 5–7 production forecast by 22,700 units to 226,300 units. The revision represents a shift from the earlier expectation that elevated inventories and relatively limited backlogs would produce more production moderation during the second half of 2026.
The stronger production outlook does not eliminate inventory risk. Classes 5–7 inventories remained elevated after production outpaced orders in both 2024 and 2025. Retail sales increased 4.3% year over year in July, but the inventory-to-sales ratio rose as daily sales softened. Higher production could push more of the eventual inventory correction into 2027 and 2028.
Demand also varies considerably by application. Vocational and service-oriented equipment continues to receive support from infrastructure, utility, energy, construction, commodity, and data-center-related investment. Consumer-, housing-, and small-business-sensitive applications remain more exposed to financing pressure and uneven economic confidence.
For dealers, leasing companies, OEMs, and suppliers, production and inventory planning should remain tied to confirmed orders, application-level demand, body-builder throughput, retail follow-through, and the pace at which elevated inventories normalize. Broad medium-duty averages may conceal meaningful differences among customer segments.
Trailers
The trailer market is moving into a more constructive phase as improving carrier profitability, aging fleets, replacement needs, and stronger truckload rates support equipment planning. Quotation activity remains brisk, and some manufacturers have opened 2027 orderboards earlier than normal as fleets begin planning next year’s capital expenditures.
Net trailer orders totaled approximately 15,700 units in July, increasing 16% sequentially and 94% year over year. Order activity has now exceeded expectations for several months, although comparisons remain influenced by unusually weak conditions in 2025.
Backlogs ended July at approximately 78,400 units, more than 13% above year-ago levels. The backlog-to-build ratio increased to five months, committing the industry into the fourth quarter but remaining below the long-term average. Cancellation activity improved to 0.7% of backlog, although dealers and fleets continue to adjust orders as they manage inventories and reconsider future equipment needs.
The trailer market forecast remains grounded primarily in replacement, fleet age, and improving freight economics rather than indiscriminate expansion. Dry van and reefer fleets have contracted, freight activity has grown relative to available equipment, and rising maintenance costs and downtime are strengthening the case for replacement.
Conditions vary by trailer type. Dry vans are benefiting from tighter truckload capacity and stronger rate conditions. Reefer replacement needs remain important because of specialized-capacity requirements and historically old equipment. Flatbed and vocational trailer demand continues to receive support from construction, infrastructure, utility, energy, commodity, and data-center-related activity.
For fleets, trailer manufacturers, suppliers, dealers, and finance teams, the key signals to monitor are backlog rebuilding, cancellation behavior, order conversion, material and labor availability, equipment pricing, fleet utilization, and whether improving truckload economics result in sustained replacement commitments.
Regulatory and Cost Environment
Regulatory timing and compliance enforcement remain central to the trucking industry outlook for 2026. Driver qualification rules, FMCSA enforcement, ELD-related compliance activity, nondomiciled CDL removals, English-language proficiency enforcement, driver-school constraints, and carrier-registration changes are affecting available capacity. These pressures can influence tender acceptance, lane reliability, routing-guide depth, and freight pricing even when demand remains uneven.
EPA 2027 remains an important equipment-planning consideration. The EPA’s proposed rule retains the underlying low-NOx technology requirements while introducing nonconformance penalties and potentially extending warranty and useful-life requirements to 2030. The final structure remains subject to the regulatory process, creating uncertainty around engine availability, equipment pricing, and purchase timing.
Fleets are evaluating replacement exposure, equipment availability, potential acquisition and operating-cost changes, and whether purchases should be accelerated. For manufacturers and suppliers, the challenge is preparing for pull-forward demand without assuming that stronger interest will translate into indiscriminate purchasing.
Cost pressure remains a constraint across the market. Insurance, financing, labor, maintenance, fuel, tariffs, regulatory compliance, and equipment prices continue to shape fleet investment and profitability. These pressures may limit expansion-oriented purchasing, but they also reinforce capacity discipline by making it more difficult for marginal operators to add trucks and drivers.
Zero-emission equipment continues to advance most readily in applications where routes, duty cycles, vehicle economics, and charging or fueling infrastructure can be managed predictably. Broader adoption remains dependent on cost, infrastructure readiness, operating requirements, incentives, and regulatory direction.
Outlook for 2026
The Trucking Industry Forecast 2026 points to a market moving further away from the excess-capacity conditions that pressured freight rates, carrier margins, and equipment demand during the prior downturn.
This remains a supply-driven upturn rather than a broad demand-led expansion. Driver availability has begun to stabilize, but for-hire equipment capacity remains constrained, spot and contract rates are substantially higher, and Class 8 demand is receiving support from replacement needs, improving fleet economics, limited build availability, and EPA 2027 planning.
A seasonal freight-rate lull is underway, and rising tractor sales should gradually support a capacity response. However, regulatory enforcement, higher equipment costs, and the time required to add qualified drivers and productive equipment could extend the cycle even if broader freight demand remains measured.
Medium-duty production expectations have increased materially, although elevated inventories remain a risk. The trailer market is becoming more constructive as replacement needs, fleet age, and improving carrier profitability support 2027 planning. Used-equipment transaction activity is strong, but pricing remains mixed and sensitive to equipment condition, exports, financing, and new-truck availability.
For fleets, carriers, shippers, brokers, manufacturers, dealers, leasing companies, suppliers, lenders, investors, and transportation strategy teams, the planning focus should remain on:
· Freight-rate sustainability and contract-reset timing
· Driver availability and the durability of capacity constraints
· Routing-guide resilience and service risk
· Equipment replacement and procurement windows
· EPA 2027 exposure and purchase timing
· Financing sensitivity and operating-cost recovery
· Used-equipment values, exports, and residual risk
· Trailer replacement, fleet age, and 2027 order timing
· Medium-duty inventory levels and retail follow-through
· The pace at which higher rates translate into durable fleet profitability
ACT Research helps customers evaluate these connected market-cycle signals through forward-looking Freight Intelligence, Commercial Vehicle Intelligence, and Equipment Market Intelligence. Viewing freight demand, rates, capacity, equipment production, replacement timing, and used values together provides a clearer basis for planning than any single market indicator alone.
Freight's supply-driven upturn: How long will rates rise?

Stay Ahead with Smarter Freight Insights
Success in trucking and freight comes from knowing what’s next—not just what’s now. At ACT Research, we deliver forward-looking market intelligence that helps you anticipate shifts, prepare for cycles, and stay strategically positioned. As your trusted transportation intelligence partner, we give you the tools to act with confidence—so you can optimize operations, reduce risk, and drive stronger profitability.